Replies: 10 comments 15 replies
-
|
It seems to be related to L2 and L3 cache. AFAIK on 13900K, Performance cores have access to 2MB L2 Cache "Per Core", Efficient cores have access to 4MB L2 Cache "Per Cluster". |
Beta Was this translation helpful? Give feedback.
-
|
The more ideas the better. It isn't the caches. I used a 2nd method to test the cpu speed effect. I bound the app(A1111) to a single performance core with two hyperthreads. I verified it was still fast at 39 it/s. Then I ran two simply C programs with did nothing but consume cpu time in a loop on the same two threads. These two programs would not have affected the L2/L3 cache. Effectively this cuts the available cpu perf in half for the app and I saw the same thing. |
Beta Was this translation helpful? Give feedback.
-
|
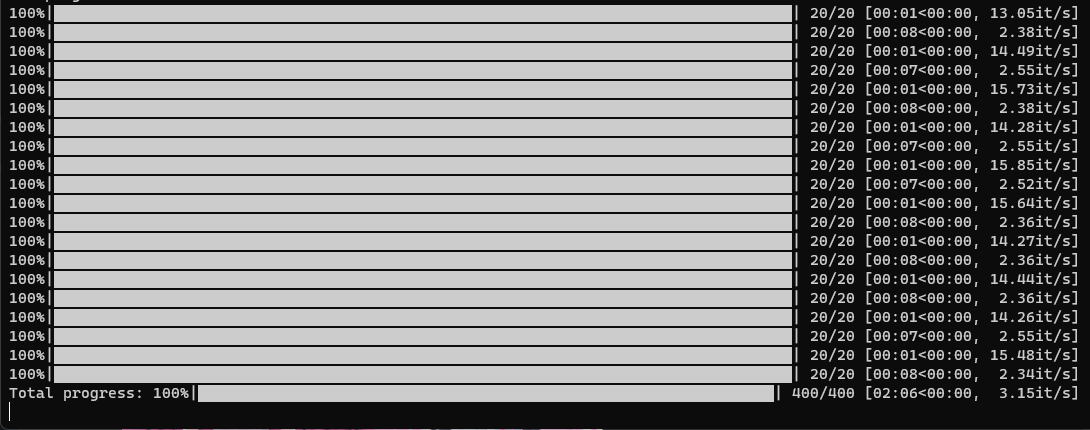
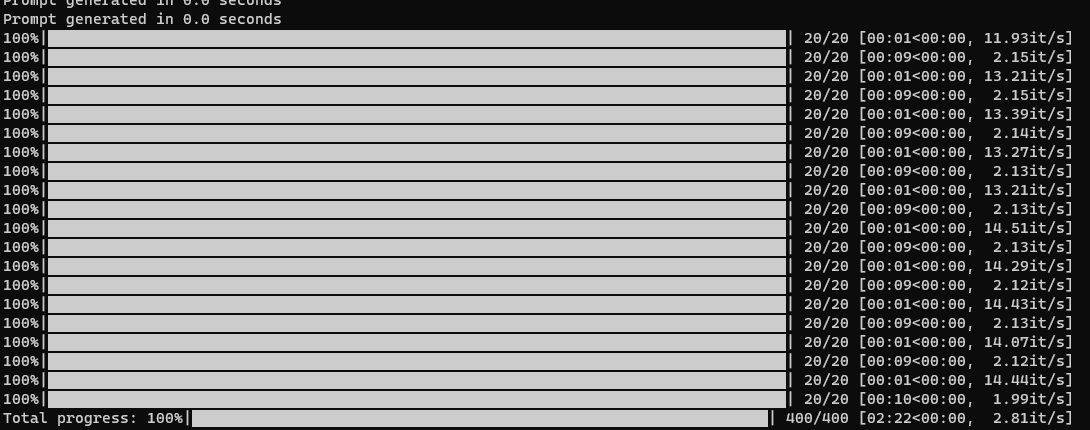
Using a 5800x3D with -30 curve optimizer on BIOS, no idea if the extra L3 cache helps. On Windows 11 with an RTX 3080 12GB using Torch 2, compiled xformers, updated .dlls and -opt-channelslast. First is just using an undervolt:
Max I saw was 16 it/s. Second is using an unnecessarily paranoid Afterburner profile with a 70% powerlimit, -350 memory underclock and a regular undervolt
Max I saw was about at about 14.5 it/s. Seems in line with these benchmarks: In both cases with longer prompts above 75 tokens I've seen it drops to about 8-9 it/s and 2-2.8 it/s with highres fix from 512x512 to 1024x1024. Edited the og post because pictures are better. |
Beta Was this translation helpful? Give feedback.
-
|
Someone suggested the reason CPU performance affects this is due to something called "CPU scheduling" vs "GPU scheduling" which appears to only be available on Windows drivers. I've found multiple people asking about GPU scheduling for Linux but not getting it. I'm not sure why NVidia isn't providing this. I'm not sure if this "scheduling" thing is in the nvidia kernel module or libcuda.so. I know I got about a 2% speed up by compiling pytorch with '-march=native" to leverage my Raptor Lake processor. I may try to do the same thing by building my own https://github.com/NVIDIA/open-gpu-kernel-modules/ |
Beta Was this translation helpful? Give feedback.
-
|
just catching-up on my reading, seems like cuda introduced its own gpu scheduler so not to rely on cpu that much. but they call it dynamic paralelism now, that's still a low-level interface and needs to be used by a framework. seems like i still don't see a way to utilize it from python wrapper, maybe i'm missing something |
Beta Was this translation helpful? Give feedback.
-
|
This may be a red herring. Remember those performance threads a month or so ago? Disabling GPU scheduling on windows increased performance. But then again that could also have been a bug In the driver. |
Beta Was this translation helpful? Give feedback.
-
|
wasn't a bug and not a red herring just because someone said so in a different thread.
|
Beta Was this translation helpful? Give feedback.
-
|
When I was running SD on a windows 11 VM on a very old CPU E5-2690v2 (go look on how slow it is compared to today's CPUs) with a 3080TI passed through, disabling GPU scheduling boosted my TI/s on smaller resolutions. |
Beta Was this translation helpful? Give feedback.
-
|
@vladmandic Sorry for my stupid nvtop comment I just deleted. GPU usage is NOT at 100% with slower CPU's. It is closer to 75% with my E-cores. |
Beta Was this translation helpful? Give feedback.
-
|
I’ve really low perf probably due to R7 1800X. This Thu I’ll upgrade to R9 5900X and I’ll report if there are also changes in speed. For me it’s really surprising, because CPU looks like “barely” used during pic creation. |
Beta Was this translation helpful? Give feedback.
-
|
(Linux user here) There's something's with python as any generation maxes out a core. I guess this is what you call scheduling? But no matter what size of generation I do one core is always maxed out. I also want to report the negative prompt slows down generation alot on slower cpus. This becomes less apparent the larger you generate as the gpu becomes the bottleneck. |
Beta Was this translation helpful? Give feedback.
-
A program that does very little real work on a CPU can still show up as 100% busy if the code is written to do "busy spinning" to wait for something else like the GPU to finish the task given to it. I am currently pondering which technique to use to measure python/C-library time vs the busy spinning. CPU profiling hasn't helped much so far because the executables haven't been compiled with symbols. But I have things is my bag of tricks still to be tried. |
Beta Was this translation helpful? Give feedback.
-
|
@aifartist you can always recompile python. I'm using a custom python build with march=native to try and get some more speed. I think it helped but not by much. |
Beta Was this translation helpful? Give feedback.
-
|
You think like I do. I am also considering building an -O3 -march version of Python. Of course, if the time is primarily in things like libcuda.so or libcudnn.so then you'd need to rebuild those. PyTorch has arch native env var I used for the build(USE_NATIVE_ARCH=1) and got about 1.5% better perf. I learn yesterday how to write a tool to get a python stack trace at a random point of time while running A1111. perf top is useless on a python process. NOTE: I have a theory that one reason why perf top is giving me mostly useless info is that compile on the fly code sitting in a malloc() buffer will have 0 symbols, even less than an optimized build that also is pass -g. Therefore it may not show everything that is happening. I can easily write a RIP/PC sampler to get an idea if there is some hidden place that code is being executed. JIT also causes this kind of problem unless specifically accounted for. FYI, the 3rd highest thing that perf top does show is gettimeofday from the VDSO at about 3%. I believe it was on the rdtscp instruction one would find in such a routine. 3% isn't alot but this almost certainly would be far higher in a VM as the rdtscp instruction traps to the kernel in most virtualized env's. There's a way to fix that by setting clocksource0 but now I'm saying to much. :-) I love debugging these kinds of things. |
Beta Was this translation helpful? Give feedback.
-
|
I may somewhat think like you but I do not have your knowledge. I only have two systems to test, my server dual E5-2690v2 and my desktop Ryzen 5600x (a little over 3x faster than my server TI/s wise). But here's an interesting observation in my tests whenever auto1111 gets Turbo Boost to 3.6ghz (very random on my server) my TI/s increase linearly. |
Beta Was this translation helpful? Give feedback.
-
|
Yes, the turbo boost is what gets me to 5.8 GHz but I seem to always get is as there are so many cores on my box that it rarely gets busy enough for the turbo boosting to be throttled. Yet another factor to take into account. |
Beta Was this translation helpful? Give feedback.
-
|
One thing I noticed is on first launch after a boot/reboot, my speed stays at about 8 it/s, but switching to a different model increases it to 14 it/s. Switching back to the original model that was loaded on launch, and switching to any other model, also keeps the increased speed. Maybe a difference in how models are loaded at launch compared to how they're loaded through the dropdown in the UI. |
Beta Was this translation helpful? Give feedback.
-
|
Always ignore the performance of the first batch of images generated when first starting A1111. |
Beta Was this translation helpful? Give feedback.
-
|
Damn! I wish I had googled python profiling tools at the beginning of the day instead of near the end. It was so easy. The only downside is results can be skewed due to async operations. This can be corrected by: 13207464 function calls (11804587 primitive calls) in 25.760 seconds Ordered by: internal time ncalls tottime percall cumtime percall filename:lineno(function) |
Beta Was this translation helpful? Give feedback.
-
|
Here's hoping you find the cause |
Beta Was this translation helpful? Give feedback.
-
|
I've also recently seen a pretty cool profiler for python that does CPU/GPU/Memory profiling (https://github.com/plasma-umass/scalene) in case it might give some more details that other tools haven't |
Beta Was this translation helpful? Give feedback.
-
|
@aifartist not directly related, but definitely has an impact especially on lower end cpus #6932 (comment) |
Beta Was this translation helpful? Give feedback.
-
|
and one more dead-end - tried compiling native python 3.11 which is supposed to be much faster than python 3.10 well, no issues building python, but.... |
Beta Was this translation helpful? Give feedback.
-
The program that does AI interation needs to do the matrix multiplications/adds and the activation function. Depending on what type of activation function is implemented and the number, it's most likely to be done by the CPU. Because the CPU is faster to do different things at the same time and is built to do complex math with less steps than the GPU. The CPU is also working on reading the data from the RAM or SSD, processing the data and then transferring the data with the instructions to the GPU |
Beta Was this translation helpful? Give feedback.
Uh oh!
There was an error while loading. Please reload this page.
-
There are those with a 4090 that get near the 39 it/s I get and those that don't. Yesterday trying to figure out why someone else was only getting 34 it/s I wondered if a slower CPU would have any difference compared wiht my 5.8 GHz i9-39000K. Didn't think I had a good way to test that. Then I realize I had a CPU that was both fast and slow. The Raptor Lakes have two kinds of cores. (P) and (E) cores. I used the Linux 'taskset' command to bind the A1111 threads to the slower E-cores and my it/s drops from 39 to 27.5!
Why does the CPU speed make such a huge difference for what should be a largely GPU operation? Today I'm going to start drilling down to find out.
Ideas would be welcome. I even tried to binary patch a 'pause' instruction I found during cpu profiling into a NOP instruction. It kind of looks like a lot of time is spent in some polling loop. A pause instruction is often added to such loops. Spinlock implementations typically do that. However, this didn't speed it up. Hmmm, what should I try next...
Beta Was this translation helpful? Give feedback.
All reactions