Replies: 1 comment 2 replies
-
|
Hi @gsp97, hm interesting. Unfortunately, given how we implemented the table, it's not possible to add colors to the rows. |
Beta Was this translation helpful? Give feedback.
-
|
Is there a way that it can be changed in the package code? |
Beta Was this translation helpful? Give feedback.
-
|
I don't think so. We create the tables by making each column an "xtick label", i.e. the table is constructed like this: While it is possible in matplotlib to change xtick label colors - that would only change the colors of columns, but you want rows. So without an alternative implementation of at-risk tables, I don't think this can be done. |
Beta Was this translation helpful? Give feedback.
Uh oh!
There was an error while loading. Please reload this page.
Uh oh!
There was an error while loading. Please reload this page.
-
Hi Cameron,
Thanks for extending your helping hand and building the package . This is making a KM work get completed at ease.
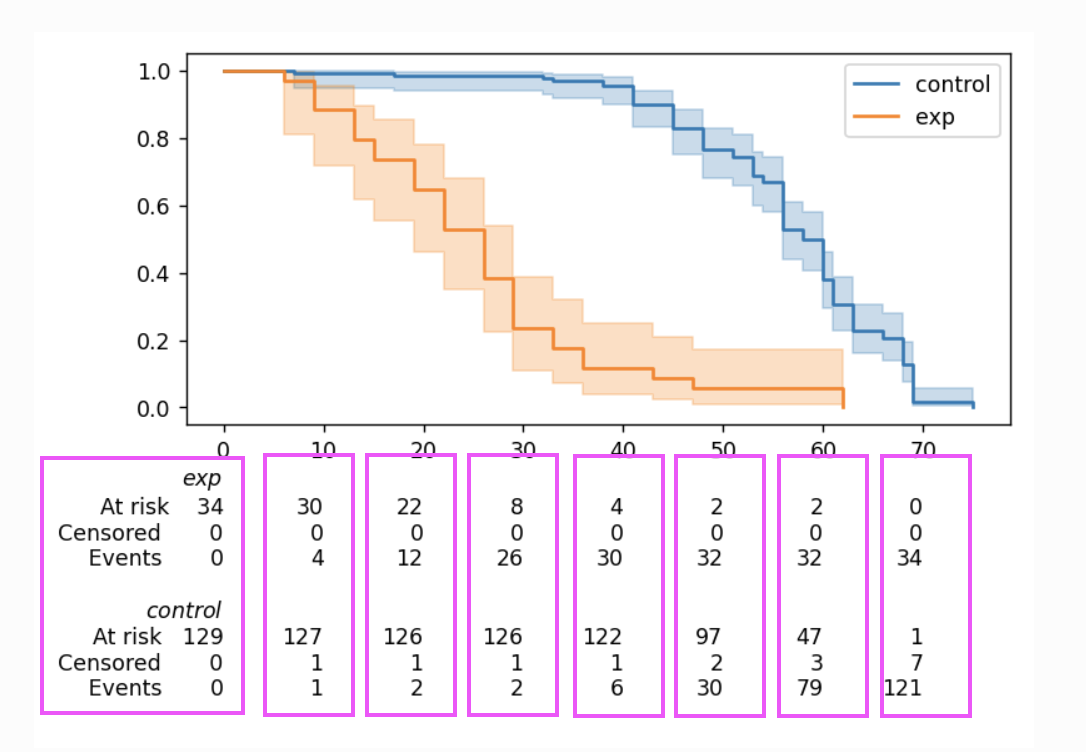
I am working on KM cumulative density and I have 6-7 groups where I need at risk counts to be represented in the same color as of the lines are being represented in the curve.
I tried using color = list of colors or color = ax which is not a right way
Please do suggest me a solution
Thanks in advance!!
Beta Was this translation helpful? Give feedback.
All reactions