Visualization Bayesian workflow #84
hyunjimoon
started this conversation in
people; relating
Replies: 1 comment
-
|
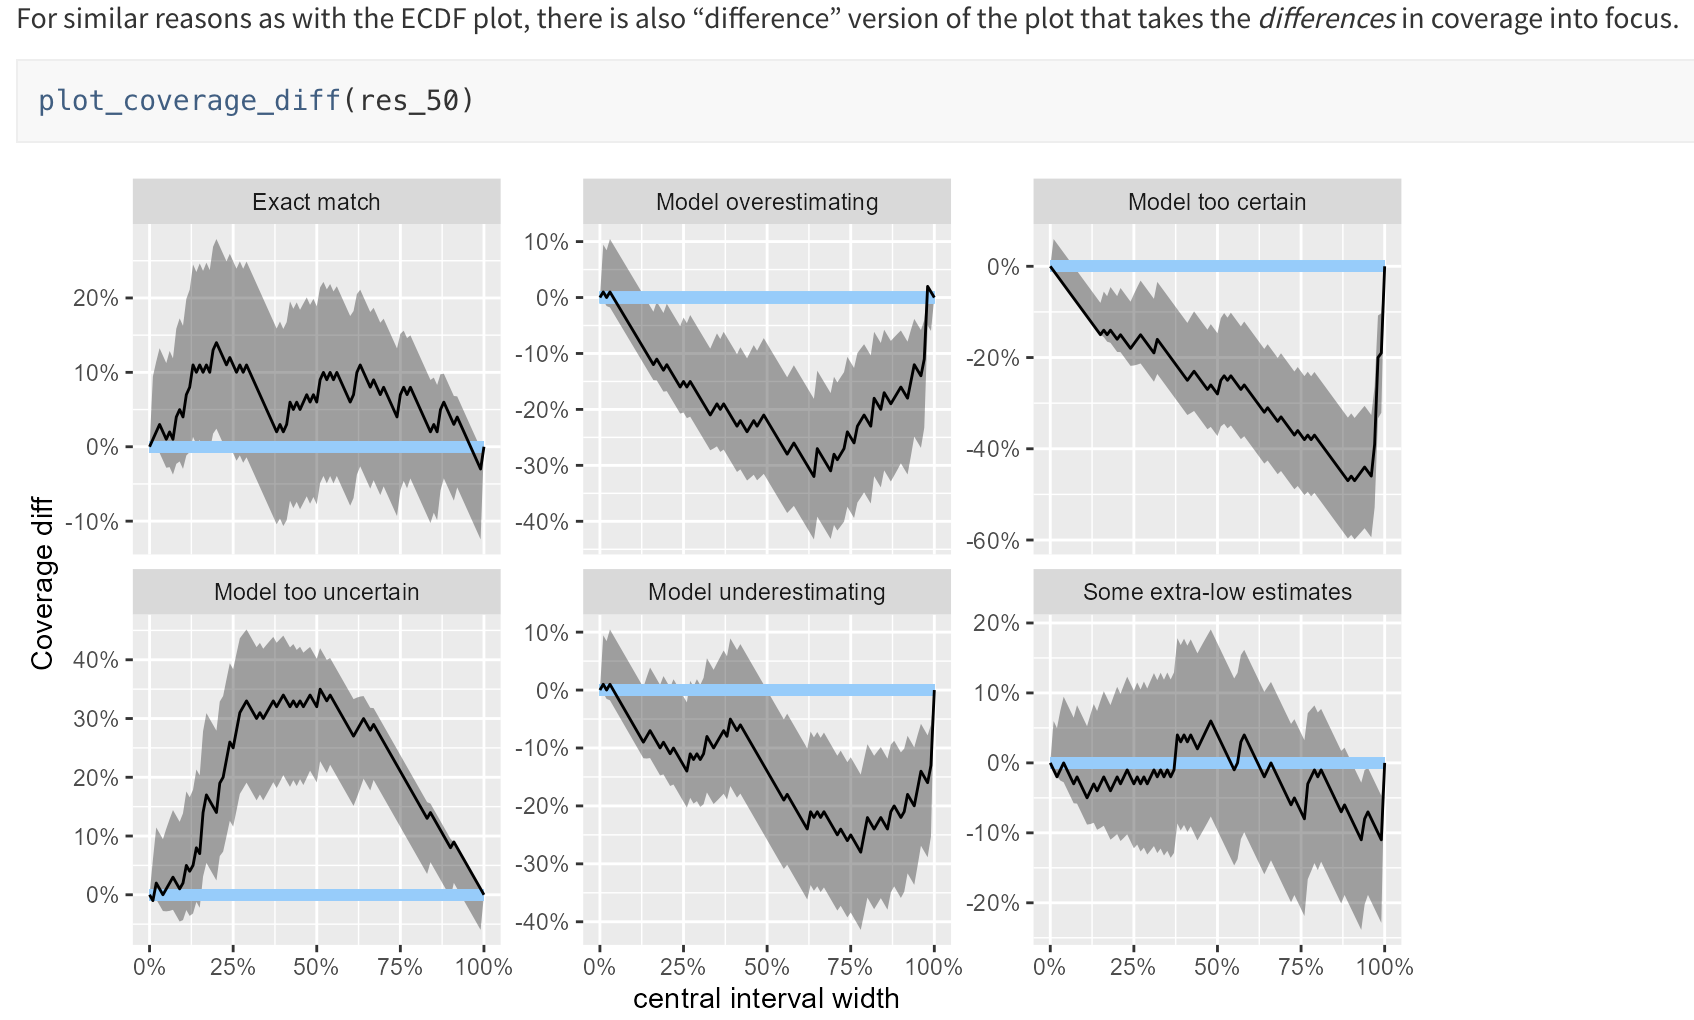
@tomfid having coverage plot would be effective; but I wonder whether vensim sensitivity check could supply this function easily. Once the output format of stanify (both in python and r (@jandraor)) and vensim is unified, we can work on plot function together. Since SBC package in R supports the following more info in this vignette, we can think of ending out analysis in R (plotting and interactive EDA e.g. shinystan)
|
Beta Was this translation helpful? Give feedback.
0 replies
Sign up for free
to join this conversation on GitHub.
Already have an account?
Sign in to comment
Uh oh!
There was an error while loading. Please reload this page.
-
Beta Was this translation helpful? Give feedback.
All reactions