Differenitial analysis and peak-to-gene correlation anlaysis in Single-cell multiomic analysis identifies regulatory programs in mixed-phenotype acute leukemia #1120
RegnerM2015
started this conversation in
General
Replies: 1 comment 1 reply
-
|
I'm not able to answer this and @jgranja24 no longer is involved in active maintenance of ArchR. Since this is a publication-specific question that isnt related to ArchR per-se, I would email the corresponding author. Sorry to not be of more help. |
Beta Was this translation helpful? Give feedback.
1 reply
-
|
Sounds good! Thank you for getting back to me. |
Beta Was this translation helpful? Give feedback.
Sign up for free
to join this conversation on GitHub.
Already have an account?
Sign in to comment
Uh oh!
There was an error while loading. Please reload this page.
-
Hi @rcorces and @jgranja24,
I have methodological question about the analyses performed in "Single-cell multiomic analysis identifies regulatory programs in mixed-phenotype acute leukemia"
The differential analysis between cancer and normal used a "nearest-normal" approach. After projecting the cancer cells from each patient onto the normal reference, you find the k-closest nearest normal cells for each MPAL cell.
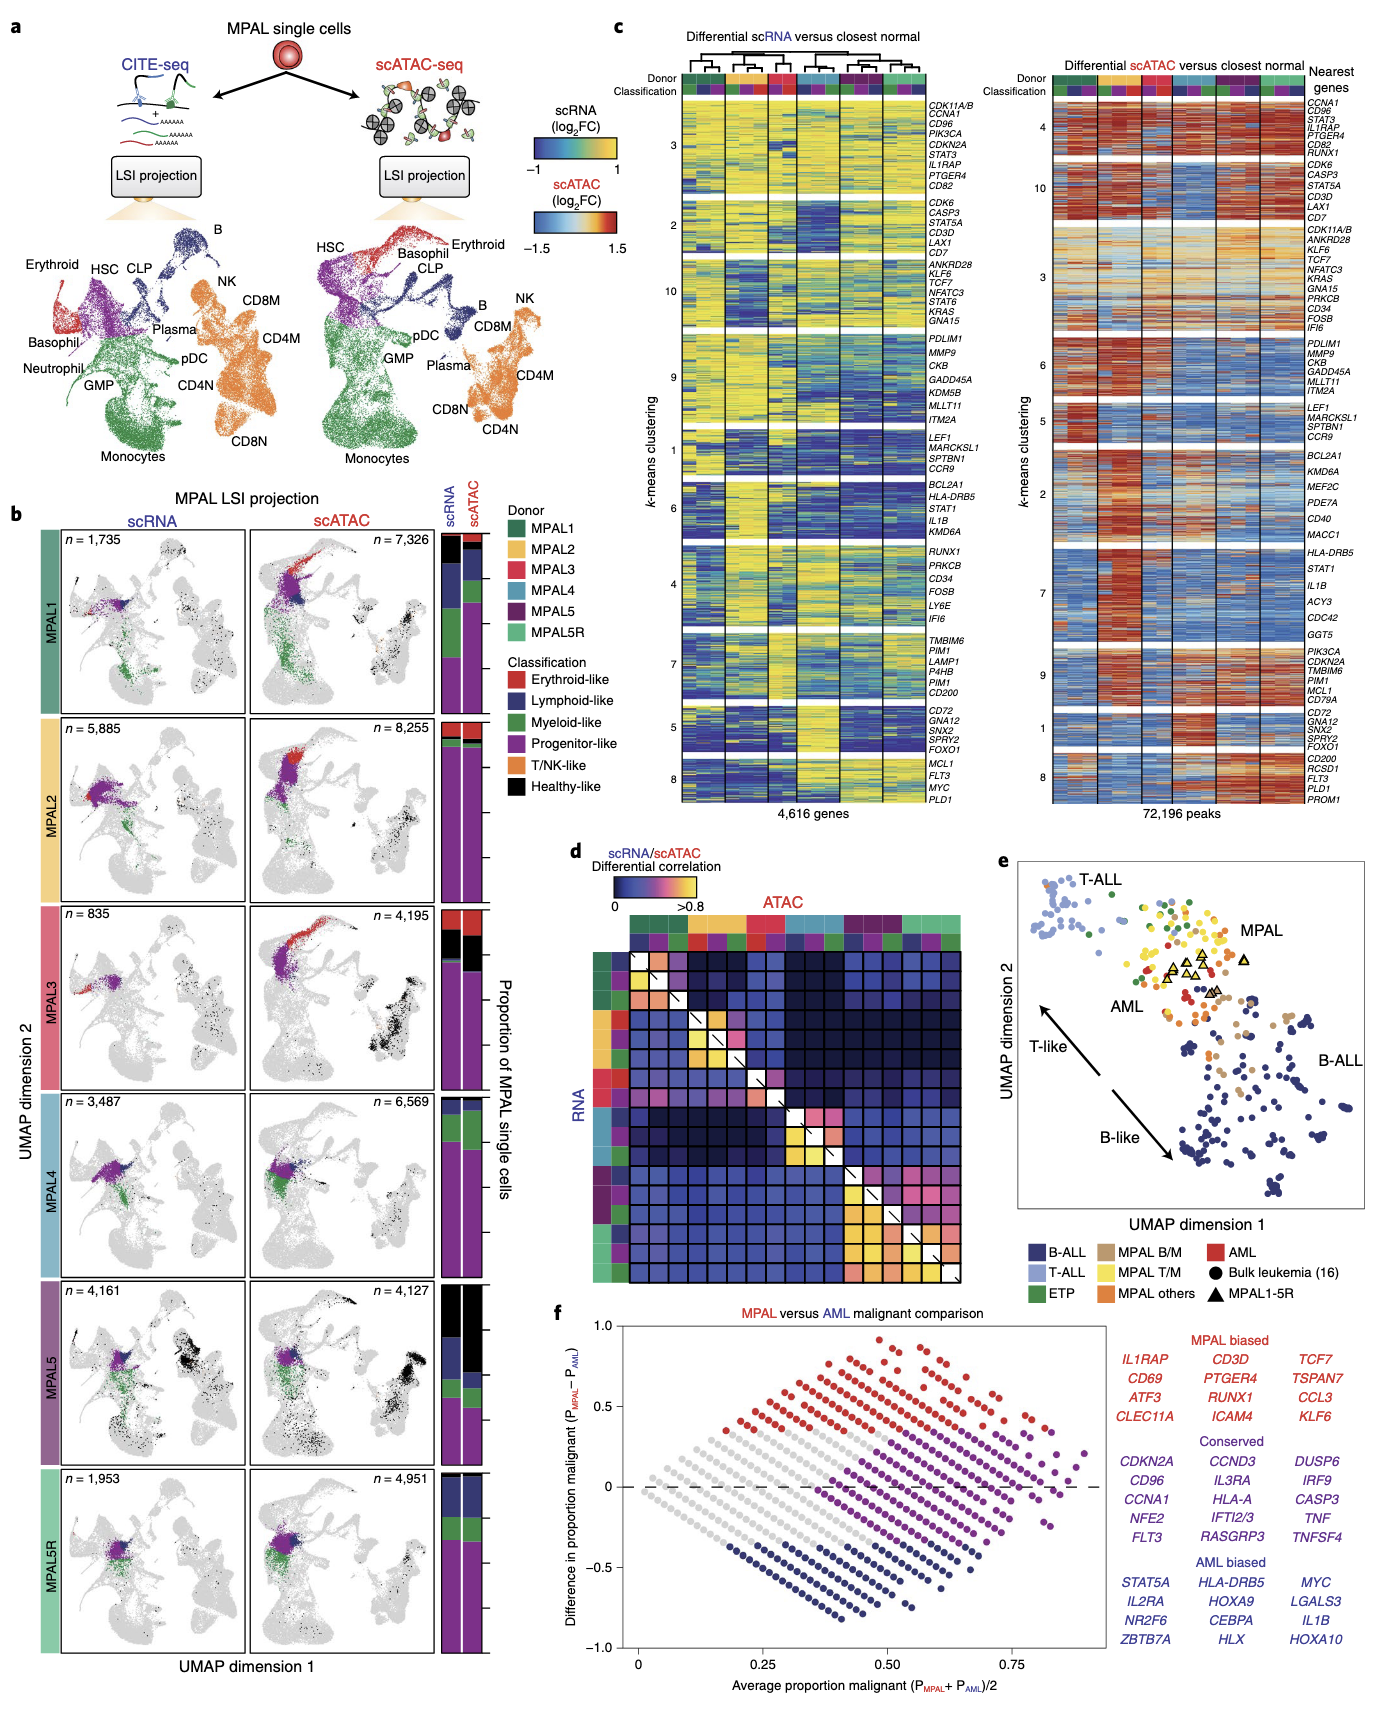
From the legend of Fig. 2:Left, scRNA-seq heat map of upregulated genes (LFC > 0.5 and two-sided t test FDR < 0.01) log2(fold changes) comparing MPAL disease subpopulations to closest non-redundant normal cells
How are the non-redudant normal cells defined here? What value of k is used in the k-NN to identify these background cells and how does this k differ from the k used in creating aggregates for peak-to-gene correlation analysis?
I think that k for the peak-to-gene analysis aggregates would have to be sufficiently smaller than the k used in the differential analysis. Otherwise, you may be creating metacells that contain both cancer and normal cells during the peak-to-gene correlation analysis.
Your thoughts on this and feedback would be greatly appreciated! Thank you!
Beta Was this translation helpful? Give feedback.
All reactions