Consideration of Simpson's Paradox in peak-to-gene correlation analysis #1559
Replies: 4 comments 1 reply
-
|
For additional context, a similar question was raised here: cole-trapnell-lab/cicero-release#55 |
Beta Was this translation helpful? Give feedback.
-
|
My personal experience has been that the vast majority of peak-to-gene links identified by scATAC-seq (in datasets where multiple different cell types exist) is that they are peaks that are only present in a single cell type (or subset of cell types). So the correlation is driven by correlation of the sort [has peak, has expression] vs [no peak, no/low expression]. If you were to do a peak-to-gene correlation analysis within a single cell type, then you would likely find something completely different because you would be looking for correlation within a narrowly defined cell type vs across cell types. I'm sure that the paradox you describe above occurs but I have a feeling its rare as you said. Any chance you've looked explicitly for this to gauge how common it is? |
Beta Was this translation helpful? Give feedback.
-
|
I have not checked the tutorial dataset for this, but for the datasets I have worked with, I have found typically <1% of peak-to-gene links are affected by this paradox (positive correlation in cell type A, positive correlation in cell type B, but negative correlation with cell types A/B together). Therefore, this paradox is likely not a concern. Thanks for sharing your thoughts and ideas on this! |
Beta Was this translation helpful? Give feedback.
-
|
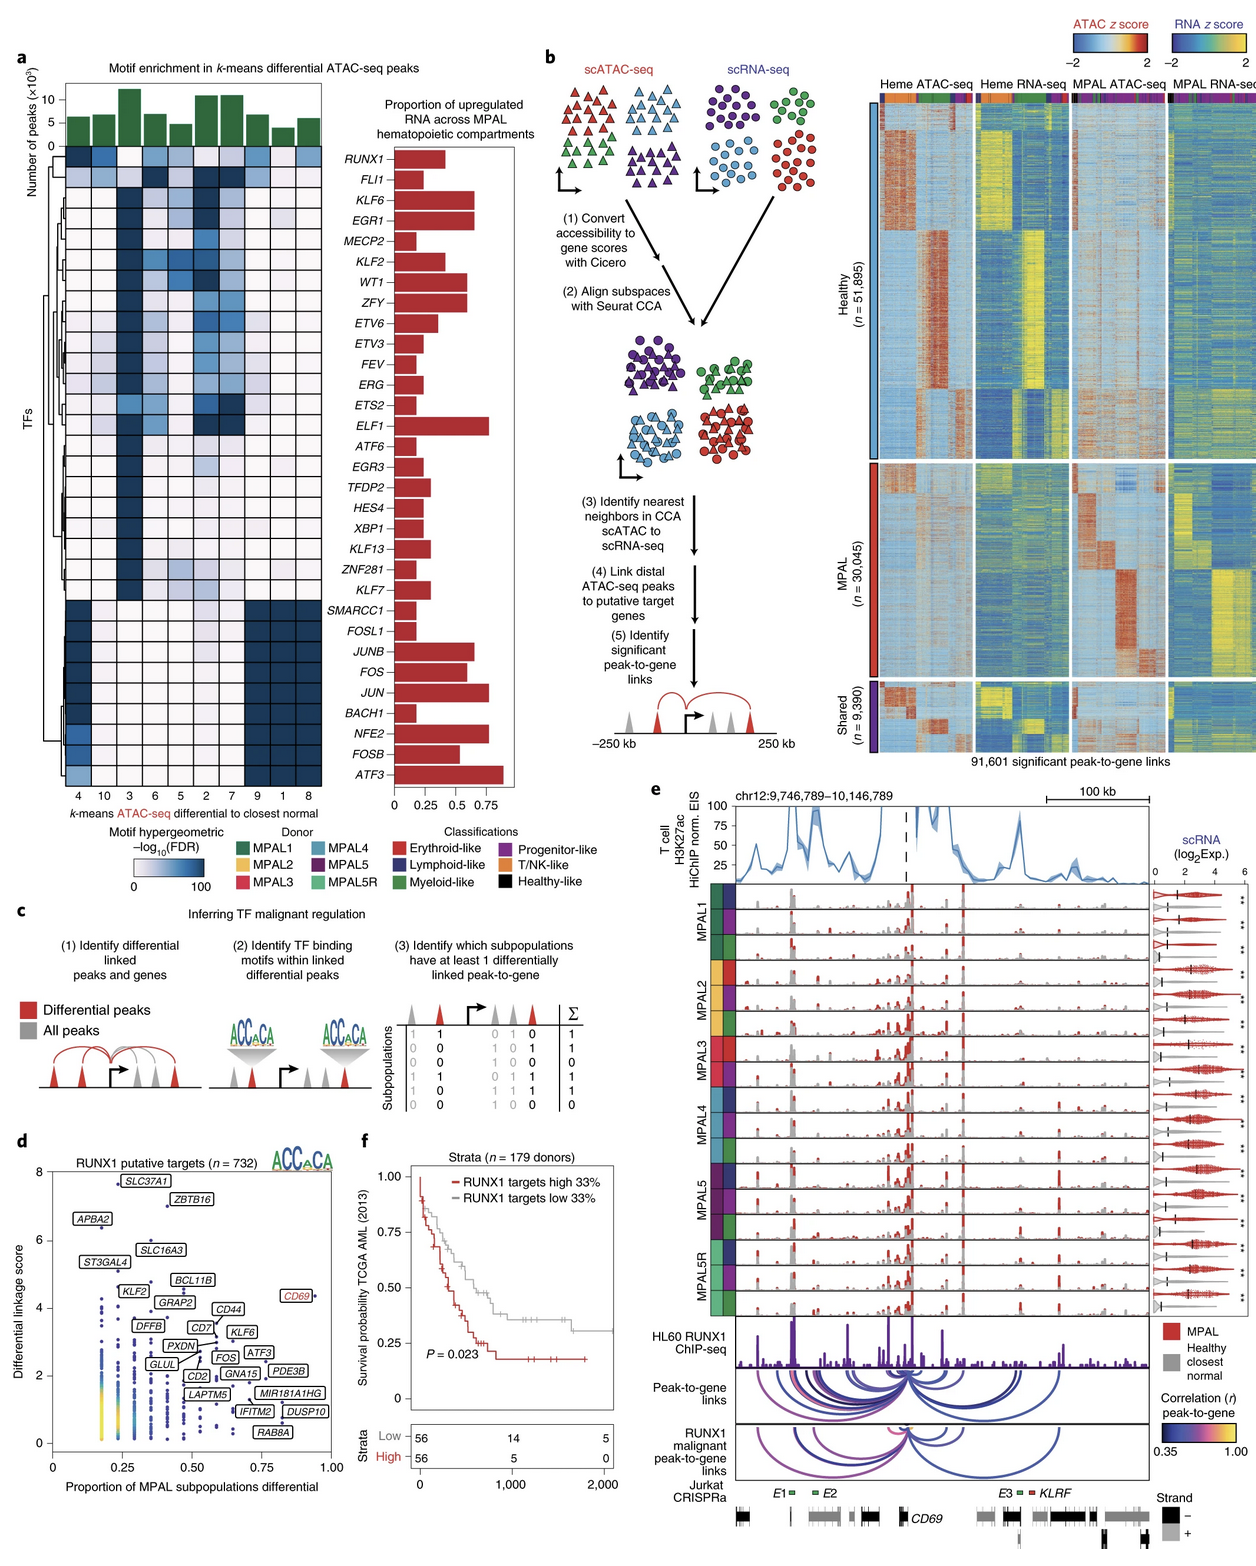
For additional context, this question was inspired by Granja et al.'s Figure 3B from Nat. Biotech where the P2Gs were computed separately for MPAL cancer and healthy cells arriving at MPAL-specific, healthy-specific, and shared P2Gs:
https://www.nature.com/articles/s41587-019-0332-7#Sec2 However, it is still not clear to me which set of P2Gs are shown for the browser track in Panel E? Was it a concatenation of MPAL-specific, healthy-specific, and shared P2Gs? If so, how were the correlation values chosen for the shared group? |
Beta Was this translation helpful? Give feedback.
-
|
I dont know the answer to this. I'll see if Jeff does. |
Beta Was this translation helpful? Give feedback.
Uh oh!
There was an error while loading. Please reload this page.
-
Hi @rcorces and @jeffmgranja,
I have been brainstorming how to identify cell type-specific peak-to-gene correlations.
Typically, we use all cells in the dataset to perform a peak-to-gene correlation analysis. Then, to determine cell type-specificity (aside from screening peak-to-gene links based on differential accessibility), one could recompute the peak-to-gene correlations in each cell type fraction individually, and see which peak-to-gene links from the full dataset are recovered specifically within a certain cell type fraction. This may shed light on which cell type is "driving the correlation" in the full dataset.
However, I realize Simpson's Paradox may play a role here (https://en.wikipedia.org/wiki/Simpson%27s_paradox). Here is an example below in the context of gene regulation (https://www.researchgate.net/figure/Simpsons-paradox-or-the-Yule-Simpson-effect-A-correlation-between-gene-A-expression-and_fig2_305311783):
In the context of ArchR, if you replace the y-axis with "peak A accessibility" it becomes clear that you could have peak-to-gene links that show this strange trend. More specifically, a peak-to-gene link may have a negative correlation in the full dataset, but actually has a positive correlation in the context of each individual cell type.
I would think that most peak-to-gene links identified using all cells would not be affected by this phenomenon, but I think this becomes relevant in the context of identifying cell type-specific mechanisms of gene regulation. What are your thoughts on this? Is there any additional information that could help me gain a better understanding?
Thank you for your help and time!
Beta Was this translation helpful? Give feedback.
All reactions