Does one need to set a seed for plotBrowserTrack? #1642
-
|
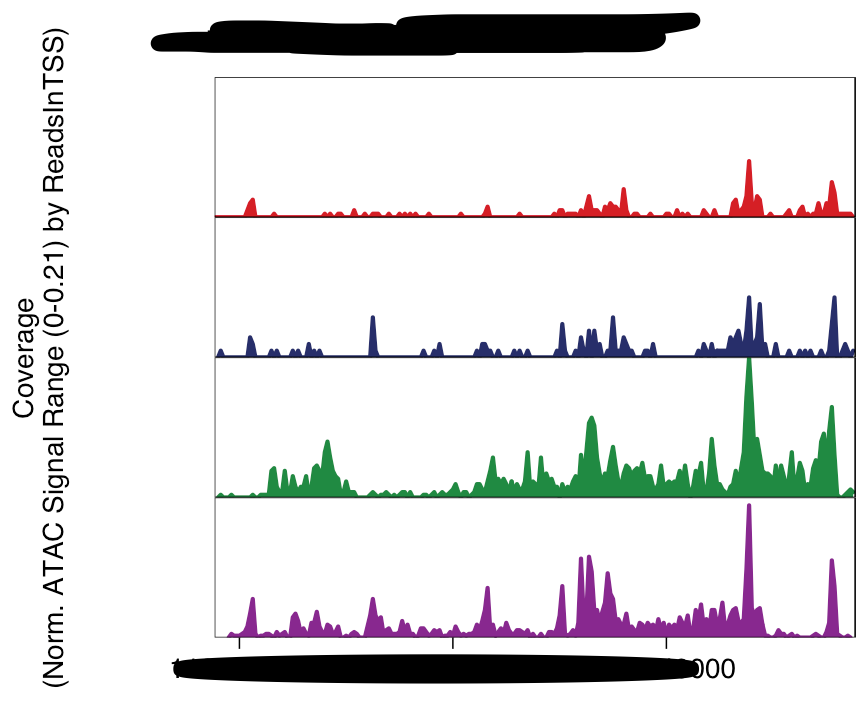
Hi @rcorces and @jeffmgranja , I noticed that the coverage scale for the bulk track plotting changes from run to run despite setting the ylim paramter to c(0, 0.999). For example, this is the result from run 1:
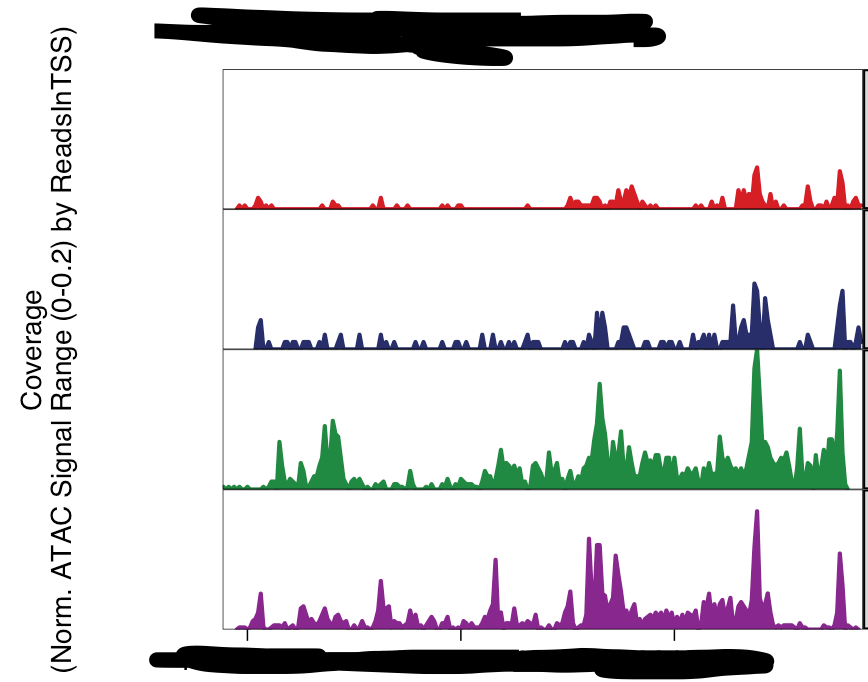
And this is the result with the same parameters from run 2:
Aside from setting a seed, which seems to maintain reproducibility internally for myself, is there another strategy or fix I could implement here? Thanks for your help! |
Beta Was this translation helpful? Give feedback.
Replies: 2 comments
-
|
This has been brought up previously and is due to randomized sub-sampling of cells when making plots. As the param docs say: Because the ylim is being set in quantile space, if the sub-sampling takes different cells, then the actual y limit of the plot will change. Certainly on your end, you can fix this by setting a seed. I'm not familiar enough with randomized operations to know if this would be reproducible across computers as well. I guess if you really wanted it to be reproducible across computers, you could set |
Beta Was this translation helpful? Give feedback.
-
|
Thanks @rcorces! This answers my question. |
Beta Was this translation helpful? Give feedback.
This has been brought up previously and is due to randomized sub-sampling of cells when making plots. As the param docs say:
Because the ylim is being set in quantile space, if the sub-sampling takes different cells, then the actual y limit of the plot will change. Certainly on your end, you can fix this by setting a seed. I'm not familiar enough with randomized operations to know if this would be reproducible across computers as well. I guess if you really wanted it to …