Peak2Gene Link Calculation #621
-
|
Hi again!
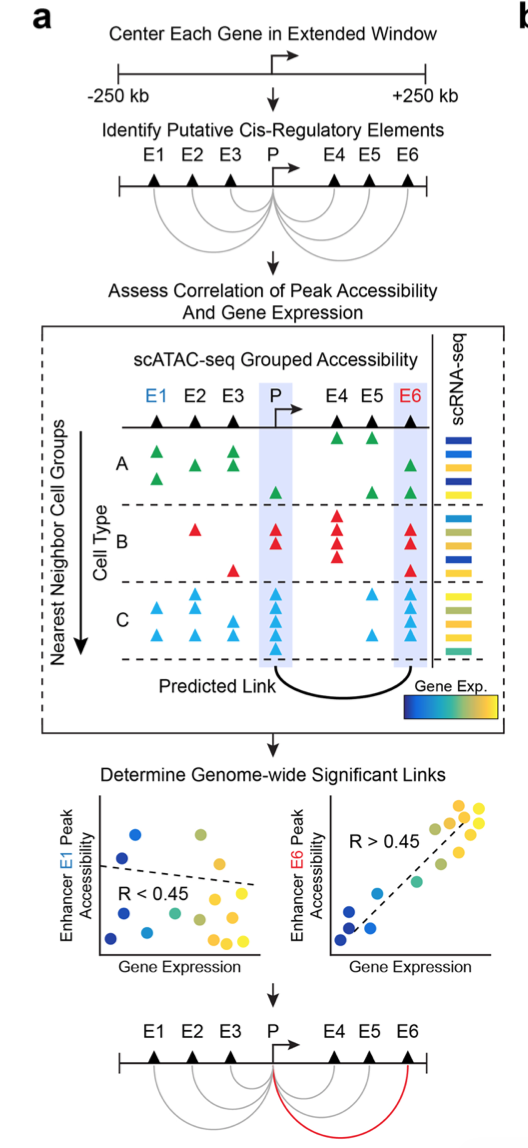
In the second panel, may I ask how the correlation between TSS and E3 was calculated? The way I thought, was that the expression of the gene seems to be correlated with the changes in the accessibility of enhancer6, but when I look at the plot, to me it looks as if the peak in the TSS is correlated to the enhancer 6 peak. I would very much appreciate it if you could clarify this. Thank you |
Beta Was this translation helpful? Give feedback.
Replies: 1 comment
-
|
The correlation for Peak2Gene links is between peak accessibility and gene expression. The figure is somewhat confusing because we showed the promoter peak in the diagram - but in my defense it would be equally as confusing to not show the promoter peak. The bottom dot plot panels I think illustrate it best with gene expression being correlated to the peak accessibility of E6. So your initial intuition was correct. Apologies for the confusion. |
Beta Was this translation helpful? Give feedback.
The correlation for Peak2Gene links is between peak accessibility and gene expression. The figure is somewhat confusing because we showed the promoter peak in the diagram - but in my defense it would be equally as confusing to not show the promoter peak. The bottom dot plot panels I think illustrate it best with gene expression being correlated to the peak accessibility of E6. So your initial intuition was correct. Apologies for the confusion.