Custom signal range for plotBrowserTrack() #903
-
|
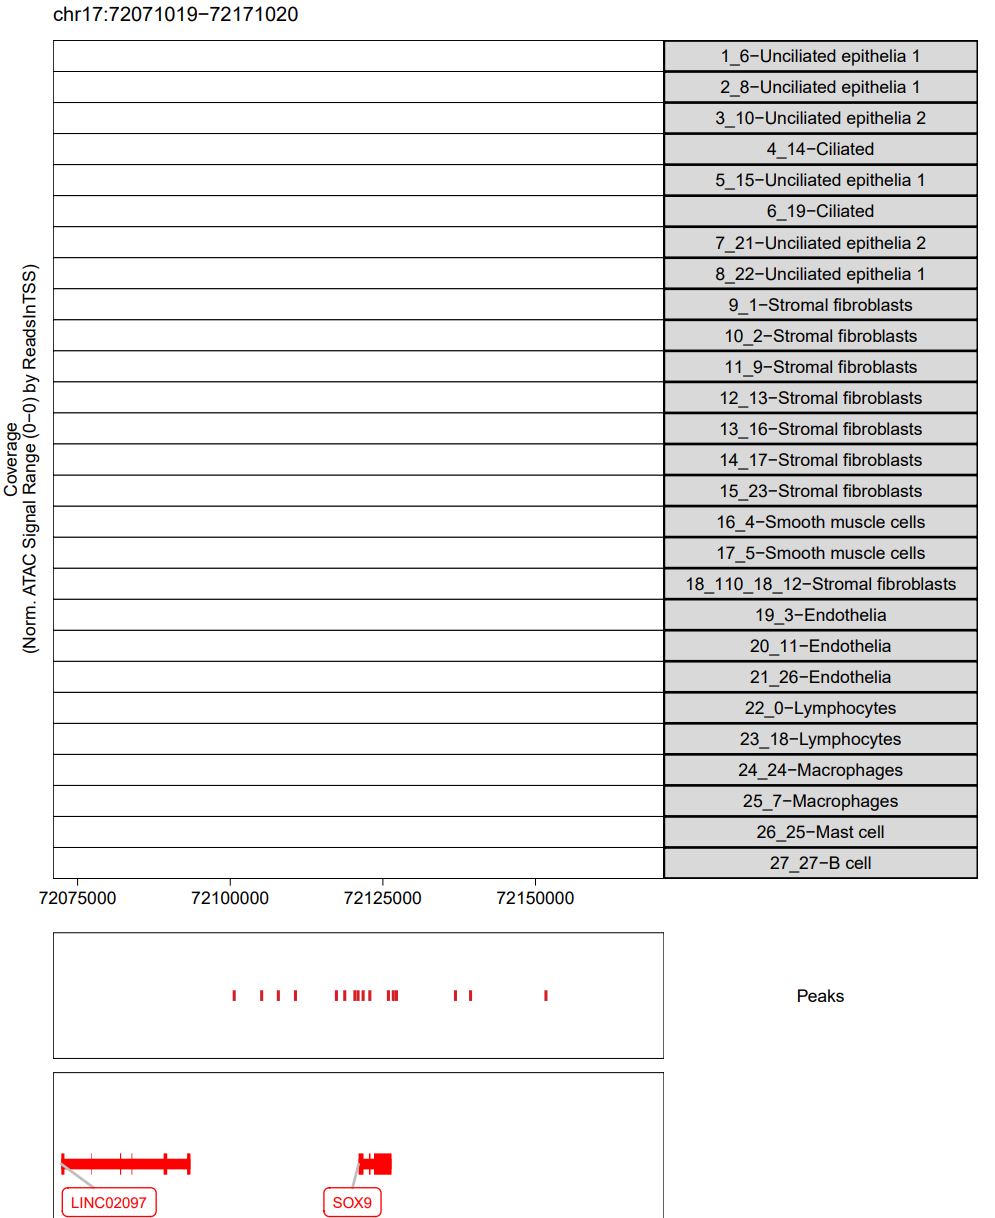
Hi @rcorces and @jgranja24 Is there a way to plot a custom signal range using the ReadsinTSS Norm method? I would like to lower the default signal range so that I can more clearly see lower signal peaks. Thanks! |
Beta Was this translation helpful? Give feedback.
Replies: 1 comment 6 replies
-
|
The |
Beta Was this translation helpful? Give feedback.
-
|
I have tried manipulating the ylim argument, but the browser track becomes blank. Does it matter that I am using ArchR 0.9.5?
|
Beta Was this translation helpful? Give feedback.
-
|
I think there was a bug in You can update this in If you could confirm that this fix works for you, I'll incorporate it into |
Beta Was this translation helpful? Give feedback.
-
|
a861399 works on my end! Thanks so much for your help! |
Beta Was this translation helpful? Give feedback.
-
|
For posterity, my changes mentioned above were not correct and actually broke the ArchRBrowser. The problem was actually with the This was in response to #1206 |
Beta Was this translation helpful? Give feedback.
-
|
Thanks! I have since updated my workflows to the latest version of ArchR so I don't anticipate having these issues. |
Beta Was this translation helpful? Give feedback.
The
ylimargument?