Harmony correction results in no UMAP separation #994
Replies: 1 comment 5 replies
-
|
There is no right answer here. I would try all of the things that you listed. In terms of QC, just make sure that you are inspecting the reads x TSS QC plots and selecting cutoffs that make sense. In my opinion, its ok to use a different cutoff for number of frags for different samples in order to exclude junk (but I would keep the TSS cutoff the same whenever possible). |
Beta Was this translation helpful? Give feedback.
-
|
Sounds like a plan! Thank you so much for your help. In the past, I implemented a Gaussian Mixture Model from mclust to identify cellular and non-cellular barcodes in each of these quality control metrics. I think Cusanovich et al. performed a similar approach to identifying high quality barcodes. However, in my experience not every sample will have a biomodal distribution in TSS enrichment or log10(nFrags) so I decided to try hard thresholds this time. I keep brainstorming and provide updates for the ArchR community!
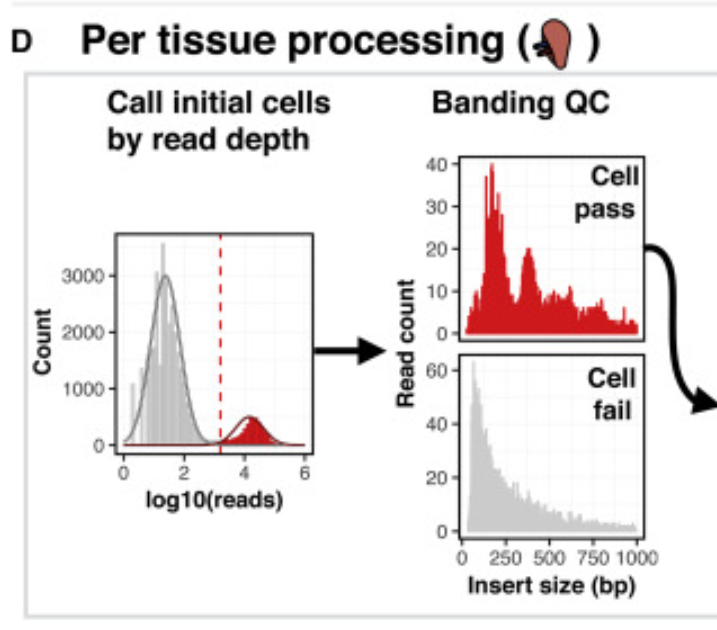
In response to, "make sure that you are inspecting the reads x TSS QC plots and selecting cutoffs that make sense": Is it correct to assume these QC plots are generated after the creation of Arrow Files but before Doublet removal? These QC plots are very helpful, but they visualize the barcodes after the removal of outliers (according to thresholds). Would it be more reasonable to view these plots using all raw barcodes before QC and determine QC thresholds from there? |
Beta Was this translation helpful? Give feedback.
-
|
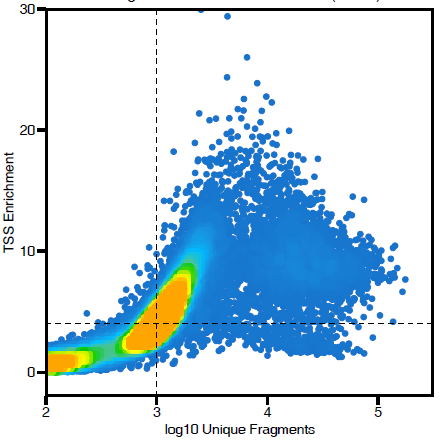
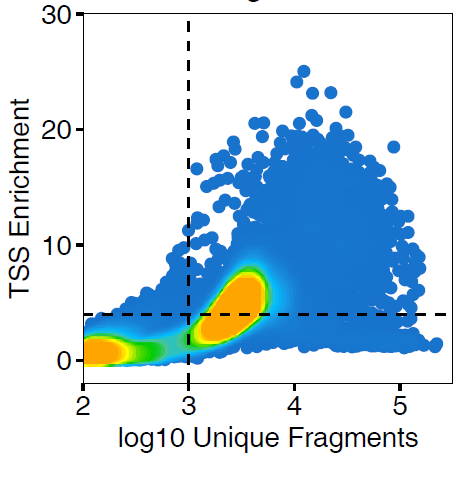
Sometimes it is easy to draw QC cutoffs but often times the default thresholds are not sufficient. For example, in this plot, it is clear that the log10 frags threshold is way too low: In this example, one might even think that the large orange blob are real cells but they are not: |
Beta Was this translation helpful? Give feedback.
-
|
Is it correct to assume these QC plots are generated after the creation of Arrow Files but before Doublet removal? These QC plots are very helpful, but they visualize the barcodes after the removal of outliers (according to thresholds). Would it be more reasonable to view these plots using all raw barcodes before QC and determine QC thresholds from there? |
Beta Was this translation helpful? Give feedback.
-
|
Well, the plots I attached above are actually before removal of any cells. But by default ArchR makes these QC plots during Arrow File creation after removal of cells based on log10 frags. I believe this was done to eliminate the bottom left corner of the plot from dominating the density coloration (as it does in the above plots, though these arent the best examples). You can always create Arrow files with floored QC thresholds and ArchR will make you these plots without filtering any cells. Its a little time consuming but accomplishes what you asked for. |
Beta Was this translation helpful? Give feedback.
-
|
Sounds good! Thanks for your help and advice. |
Beta Was this translation helpful? Give feedback.
Uh oh!
There was an error while loading. Please reload this page.
-
Hi @rcorces and @jgranja24,
Please note that I am using ArchR version 1.0.1
I have 17 samples profiled with 10x Genomics scATAC-seq. To mitigate batch/patient of origin effects, I decided to run Harmony after adding the LSI embeddings. There are 122,493 cells after quality control (minTSS = 6, minFrags = 1000, maxFrags =1e+05, doublets removed using filterDoublets() with default parameters). These seem like reasonable quality control cutoffs, but when I visualize the Harmony-based UMAP, I observe a large blob of cells with little separation. Please see the UMAP plots attached, highlighted by sample, by TSSEnrichment, and by log10(nFrags).
Which seems to be the most reasonable path forward?
Below are the PDF files and code used to generate these plots:
Plot-UMAP-TSS.pdf
Plot-UMAP-Sample.pdf
Plot-UMAP-logFrags.pdf
Beta Was this translation helpful? Give feedback.
All reactions