Replies: 35 comments 59 replies
-
|
So if you just need a first order calculation and you ignore the CG and lift due to the tailplane elevator combination then all you need is the Cl vs alpha data for the aircraft, e.g. from the JSBSim 737 model. Lines 658 to 676 in d8f9496 With that simply set the lift formula equal to the weight and iterate over the range of alpha and for each alpha solve for the speed. Use the alpha, speed points to plot your graph. So nothing specific in terms of JSBSim. If you do want to take into account varying CG and the varying tailplane elevator combination to the overall lift then one option is to use JSBSim's trim functionality. So for example choose a weight and CG combination and then use JSBSim to iterate over a bunch of trim solutions covering the speed range. For each trim solution record the alpha and now you have a set of speed, alpha points for the weight and CG combination. |
Beta Was this translation helpful? Give feedback.
-
|
Ok. I put the function at the end at the aerodynamics section.
I do not know much more about the JSBSim to make it happen. Sorry.
Yes. I would like to vary weight and CG at least. <aerodynamics>
<axis name="LIFT">
<function name="aero/coefficient/CLalpha">
<description>Lift_due_to_alpha</description>
<product>
<property>aero/qbar-psf</property>
<property>metrics/Sw-sqft</property>
<property>aero/function/kCLge</property>
<property>aero/function/kCLsb</property>
<property>aero/function/kCLsp</property>
<table>
                          <independentVar>aero/alpha-rad</independentVar>
                          <tableData>
                             -0.20     -0.68
                              0.00	0.20
                              0.23	1.20
                              0.46	0.20
                          </tableData>
</table>
</product>
</function>
</axis>
</aerodynamics>
<output name="Tutorial_1.csv" rate="60" type="CSV">
<property> aero/alphadot-deg_sec </property>
<property> aero/betadot-deg_sec </property>
<property> velocities/vc-kts </property>
<property> velocities/mach </property>
<property> aero/beta-deg </property>
<property> aero/alpha-deg </property>
<property> velocities/vtrue-kts </property>
<simulation> OFF </simulation>
<atmosphere> ON </atmosphere>
<massprops> OFF </massprops>
<aerosurfaces> OFF </aerosurfaces>
<rates> OFF </rates>
<velocities> OFF </velocities>
<forces> OFF </forces>
<moments> OFF </moments>
<position> OFF </position>
<coefficients> OFF </coefficients>
<ground_reactions> OFF </ground_reactions>
<fcs> OFF </fcs>
<propulsion> OFF </propulsion>
</output> |
Beta Was this translation helpful? Give feedback.
-
My point was this doesn't require JSBSim. The idea being you do it by hand on a piece of paper or in Excel, or as a basic python script, whatever you're comfortable with. You can repeat it for multiple weights. It just doesn't capture CG changes and the lift from the tail plane and elevator combination. Would be interesting to see how much of a difference there is when you take the CG and the tail plane elevator lift combination into account. In terms of my suggestion of using JSBSim's trim function you can take a look at some of these test cases as a starting point. https://github.com/JSBSim-Team/jsbsim/blob/master/tests/CheckTrim.py |
Beta Was this translation helpful? Give feedback.
-
|
OK. I can use python and run at different conditions. Yes I can vary weight. That is easy. It is just to change xml of the aircraft. Yes? My point is how to change the script below to cover all the aircraft mission? <?xml version="1.0" encoding="utf-8"?>
<?xml-stylesheet type="text/xsl" href="http://jsbsim.sf.net/JSBSimScript.xsl"?>
<runscript xmlns:xsi="http://www.w3.org/2001/XMLSchema-instance"
xsi:noNamespaceSchemaLocation="http://jsbsim.sf.net/JSBSimScript.xsd"
name="Trim in Cruise configuration">
<description>
Trimmed at altitude/airspeed in Cruise configuration,
run for 1 second
</description>
<use aircraft="Tutorial_1" initialize="scripts/airborne"/>
<run start="0" end="1" dt="0.00833333">
<!--
Specify the initial conditions for the test if
different than in the initialize script, and
trim the aircraft.
-->
<event name="Trim">
<condition> simulation/sim-time-sec ge 0.0 </condition>
<set name="ic/vc-kts" value="191.0"/>
<set name="ic/h-sl-ft" value="4779.0"/>
<set name="simulation/do_simple_trim" value="1"/>
</event>
</run>
</runscript> |
Beta Was this translation helpful? Give feedback.
-
|
Yes you can vary the weight and CG via the aircraft's xml file. In terms of different configurations for take-off, climb, cruise, descent, landing etc. that's really just a matter of setting the flap and gear configuration which you can do via your script or in python to set the gear position and flap position for the different configurations you want to test/analyse. |
Beta Was this translation helpful? Give feedback.
-
|
OK. So I have a trim-approach script here. <?xml version="1.0" encoding="utf-8"?>
<?xml-stylesheet type="text/xsl" href="http://jsbsim.sf.net/JSBSimScript.xsl"?>
<runscript xmlns:xsi="http://www.w3.org/2001/XMLSchema-instance"
xsi:noNamespaceSchemaLocation="http://jsbsim.sf.net/JSBSimScript.xsd"
name="Trim - Approach">
<description>
Trimmed at altitude/airspeed in Approach configuration,
run for 4 second
</description>
<use aircraft="Tutorial_1" initialize="scripts/airborne"/>
<run start="0" end="4" dt="0.00833333">
<!--
Specify the initial conditions for the test if
different than in the initialize script, and
trim the aircraft.
-->
<event name="Trim">
<condition> simulation/sim-time-sec ge 0.0 </condition>
<set name="ic/vc-kts" value="113.0"/>
<set name="ic/h-sl-ft" value="8776.0"/>
<set name="fcs/flap-cmd-norm" value="0.5"/>
<set name="fcs/flap-pos-deg" value="15.0"/>
<set name="simulation/do_simple_trim" value="1"/>
</event>
</run>
</runscript> |
Beta Was this translation helpful? Give feedback.
-
|
How do I set Lift equals to weight?
And the landing gear?
|
Beta Was this translation helpful? Give feedback.
-
|
Now I understood. You have a CL alpha curve - generic - in the aircraft xml <independentVar>aero/alpha-rad</independentVar>
<tableData>
-0.20 -0.68
0.00 0.20
0.23 1.20
0.46 0.20
</tableData>This is a good guess for what I need by considering first order calculation. Is what you are telling me? |
Beta Was this translation helpful? Give feedback.
-
|
You made a comment, but it looks like it's been deleted or edited, that said "you don't have Cl vs alpha data...". But if you don't have Cl vs alpha data how do you hope/plan to generate the type of graph you mentioned in your first post?
This particular curve in the 737 JSBSim model may look generic, but in general a good fidelity model will have a higher fidelity/more accurate Cl vs alpha data set. The accuracy of the CAS vs alpha curve that you requested will depend on the accuracy of the data you have for your model. |
Beta Was this translation helpful? Give feedback.
-
|
Yes that is it. With time I will have all the data. But I am still interested to know how to run the second order model considering trim and CG effects with JSBSim. |
Beta Was this translation helpful? Give feedback.
-
|
So if you use JSBSim and it's trim function then JSBSim will take care of all the other effects, e.g. CG differences, thrust contribution especially at lower speeds with high alpha etc. |
Beta Was this translation helpful? Give feedback.
-
|
you can close this question as answered @seanmcleod |
Beta Was this translation helpful? Give feedback.
-
|
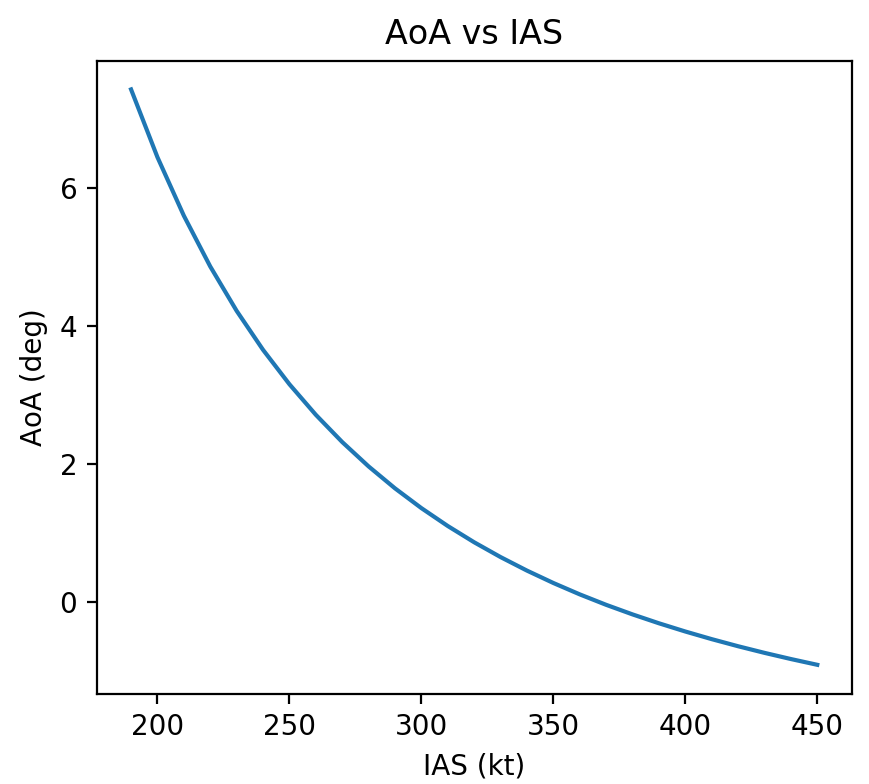
@gasilva I knocked up a basic python script, see below to generate an AoA vs Speed curve using JSBSim.
Note the fairly high minimum airspeed, that's because this was for the clean configuration, i.e. no flaps. Also for the default weight and cg as per the standard 737 model in JSBSim. You could obviously vary those independently and compare the graph you get. import jsbsim
import matplotlib.pyplot as plt
fdm = jsbsim.FGFDMExec('.') # The path supplied to FGFDMExec is the location of the folders "aircraft", "engines" and "systems"
fdm.load_model('737') # Load the aircraft 737
# Set engines running
fdm['propulsion/engine[0]/set-running'] = 1
fdm['propulsion/engine[1]/set-running'] = 1
results = []
for speed in range(120, 460, 10):
fdm['ic/h-sl-ft'] = 250
fdm['ic/vc-kts'] = speed
fdm['ic/gamma-deg'] = 0
fdm.run_ic() # Initialize the aircraft with initial conditions
fdm.run()
# Trim
try:
fdm['simulation/do_simple_trim'] = 1
results.append((fdm['velocities/vc-kts'], fdm['aero/alpha-deg']))
except RuntimeError as e:
# The trim cannot succeed. Just make sure that the raised exception
# is due to the trim failure otherwise rethrow.
if e.args[0] != 'Trim Failed':
raise
for result in results:
print(result[0], result[1])
speed, alpha = zip(*results)
plt.plot(speed, alpha)
plt.xlabel('IAS (kt)')
plt.ylabel('AoA (deg)')
plt.title('AoA vs IAS')
plt.show() |
Beta Was this translation helpful? Give feedback.
-
|
Awesome ! That's a great example of what JSBSim Python module can be used for. |
Beta Was this translation helpful? Give feedback.
-
|
You should have a correction between KCAS and KIAS. A 1.045 correction will be enough KCAS/KIAS. Great tool...It may be more complete than XML How can I change the total weight of the aircraft with python? |
Beta Was this translation helpful? Give feedback.
-
|
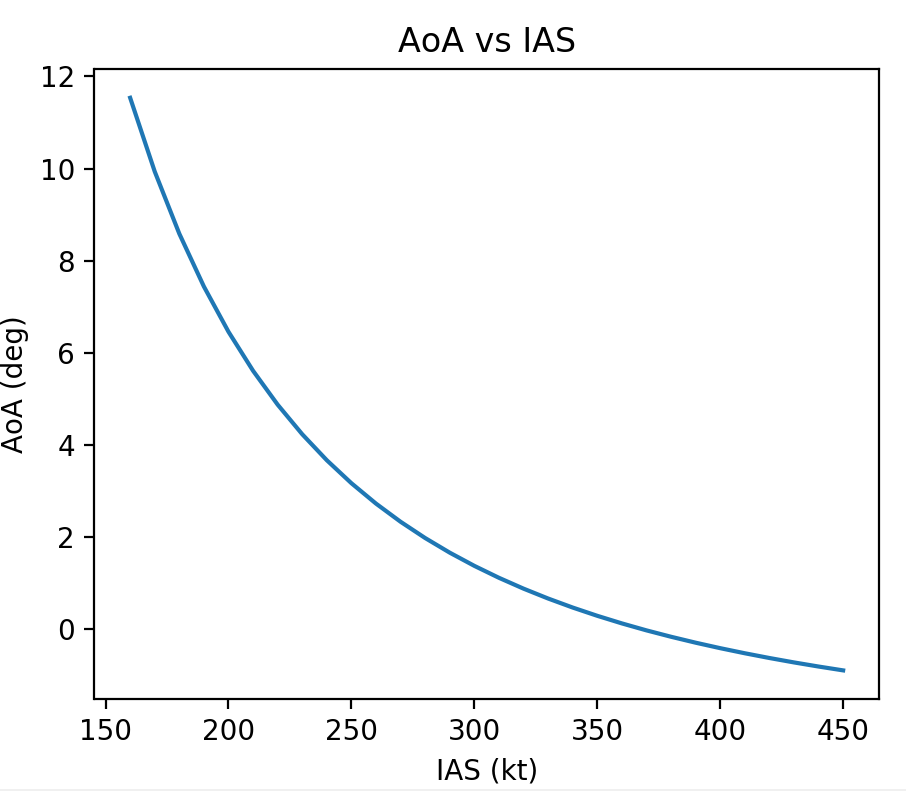
@bcoconni you should recognize some of the python code I grabbed from some of your python tests 😉 Although I wasn't surprised by the fairly high speeds given the clean no flaps config I was a bit surprised that there were no trim solutions below 200KIAS at ~7.5 degrees alpha. I was expecting a trim solution up until alpha-cl-max which is a lot higher than 7.5 degrees. Turns out that the trim code looks up an alpha range to use during it's trim calculations. If not set in the aircraft config then there are some default values. case tAlpha:
control_min=fdmex->GetAerodynamics()->GetAlphaCLMin();
control_max=fdmex->GetAerodynamics()->GetAlphaCLMax();So I set min and max values in my python code. # Set alpha range for trim solutions
fdm['aero/alpha-max-rad'] = math.radians(12)
fdm['aero/alpha-min-rad'] = math.radians(-4.0)Which now shows trim solutions down to 160KIAS 11.5 degrees alpha.
|
Beta Was this translation helpful? Give feedback.
-
|
you should include import math in the first lines also.
|
Beta Was this translation helpful? Give feedback.
-
|
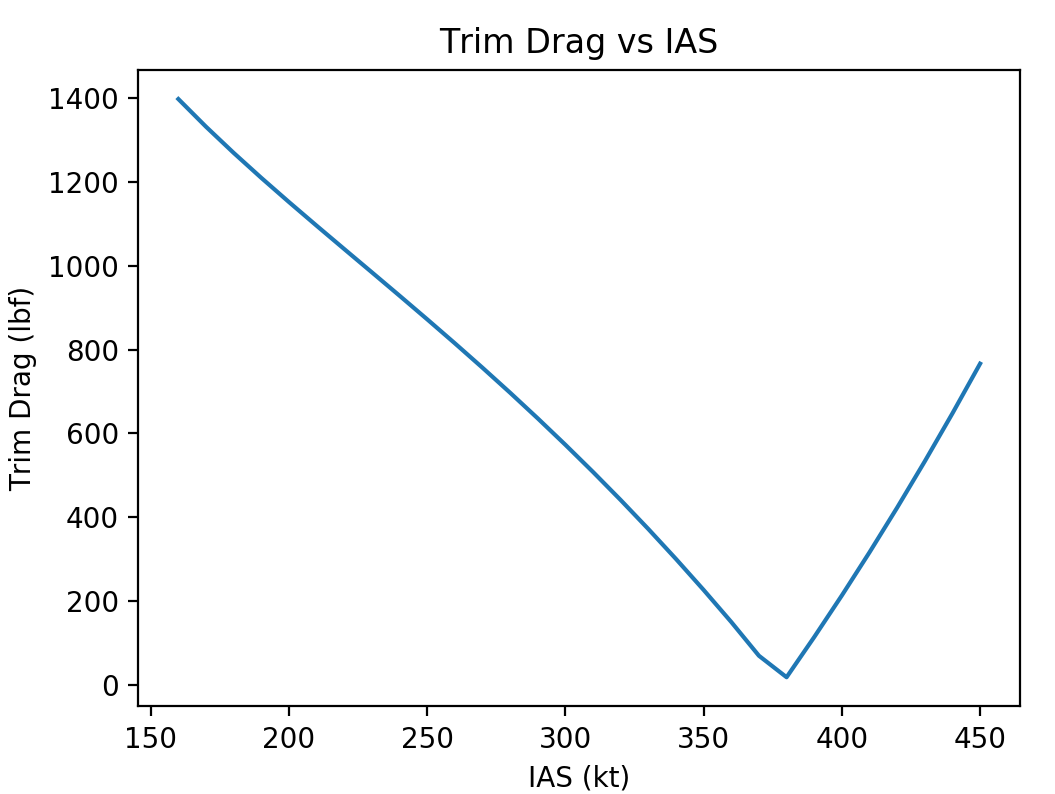
@gasilva there was mention of trim drag early on in this thread. So I've plotted the trim drag simply by recording results.append((fdm['velocities/vc-kts'], fdm['aero/alpha-deg'], fdm['aero/coefficient/CDde']))
Don't be confused by the term <function name="aero/coefficient/CDde">
<description>Drag_due_to_Elevator_Deflection</description>
<product>
<property>aero/qbar-psf</property>
<property>metrics/Sw-sqft</property>
<property>fcs/mag-elevator-pos-rad</property>
<value>0.059</value>
</product>
</function> |
Beta Was this translation helpful? Give feedback.
-
|
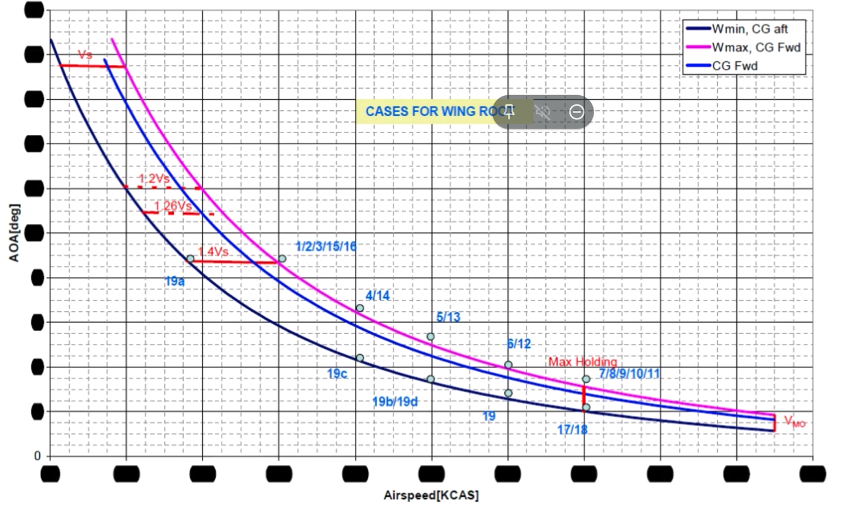
Those curves are very important for icing analysis. It will give the AOA range at given airspeed. It will generate limits of droplets impingement at the bodies like wing, stabilizer, antennas, radomes, probes and others.
|
Beta Was this translation helpful? Give feedback.
-
|
But a curve like that is OK. It has all the information. See that varying weight and CG are essential to have all the curves or the envelope |
Beta Was this translation helpful? Give feedback.
-
Despite it is less general, this curve is more important for icing since it is focused in holding conditions. The envelope is more general but not so important for icing. |
Beta Was this translation helpful? Give feedback.
-
|
Is the blue line (CG Fwd) for some specific weight you're analyzing? |
Beta Was this translation helpful? Give feedback.
-
The curves give a range of angle attack for leveled flight airspeed. It is essential for icing analysis since it will give the maximum impingement area. |
Beta Was this translation helpful? Give feedback.
-
|
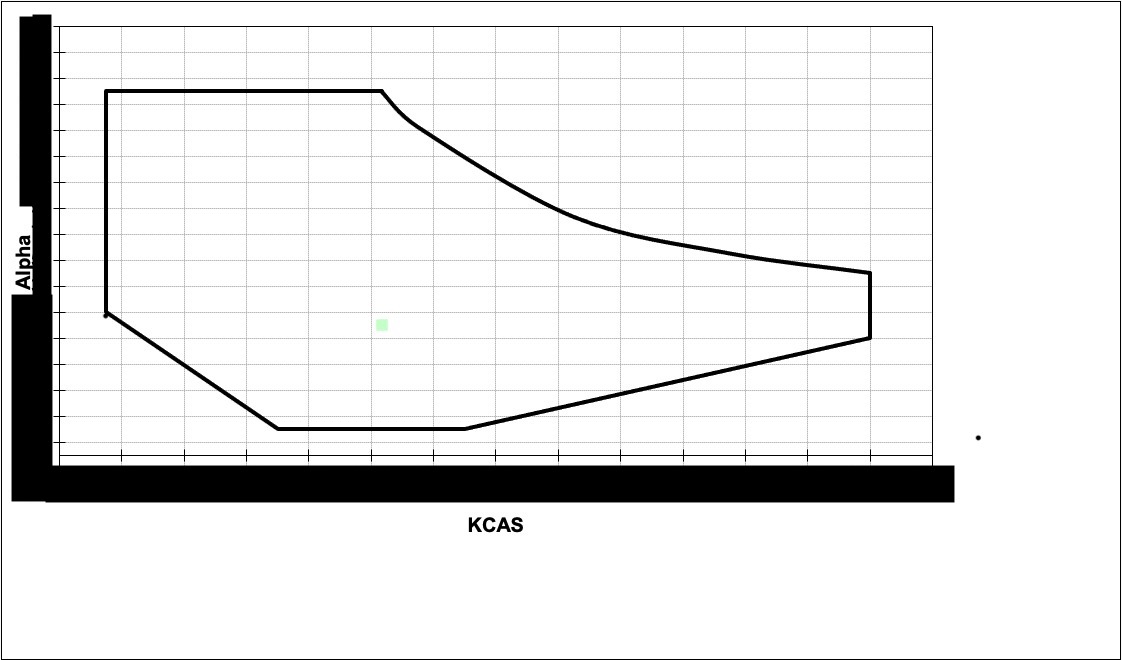
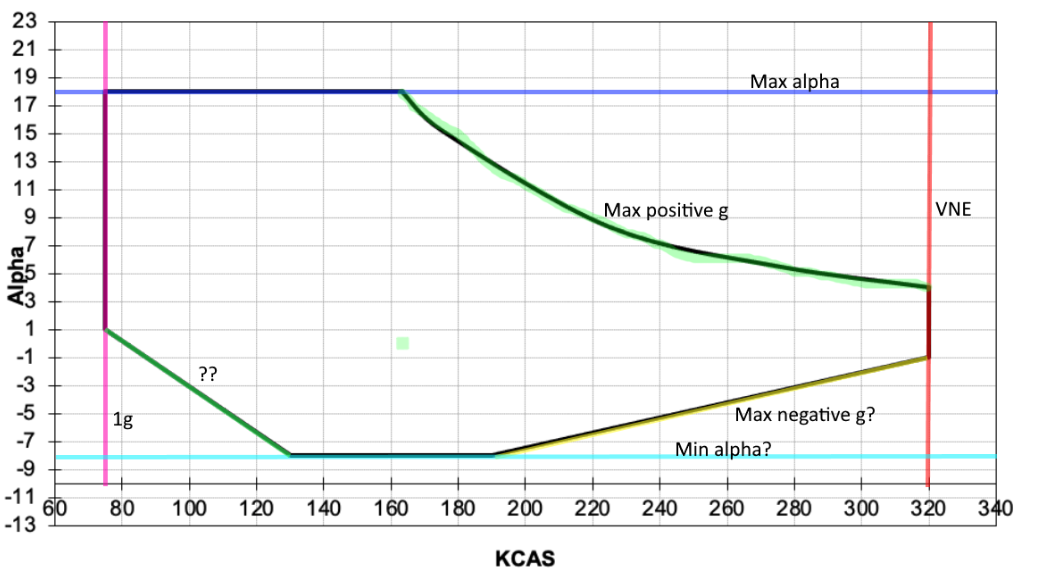
In terms of generating the complete envelope you showed. I'm trying to understand some of the logic behind the limits in order to write a script that could generate one. So I've marked up your example envelope with guesses for some of the limits. Can you confirm whether my guesses are correct? There are a couple with '?' that I'm less sure about. Can you explain those limits as well?
|
Beta Was this translation helpful? Give feedback.
-
|
I found a way to modify the CG and weight in aircraft .xml file with python. import xml.etree.ElementTree as ET
# Open original file
tree = ET.parse('global5000.xml')
root = tree.getroot()
# finding the state tag and their child attributes.
for x in root.findall('mass_balance'):
y = x.find('emptywt').text
x.find('emptywt').text='48235'
print(y)
for x in root.findall('mass_balance/pointmass'):
y = x.find('weight').text
x.find('weight').text='15172'
print(y)
for x in root.findall('propulsion/tank'):
y = x.find('contents').text
x.find('contents').text='2000'
print(y)
for x in root.findall('mass_balance/location'):
y = x.find('x').text
x.find('x').text='750'
print(y)
# Write back to file
tree.write('file_new.xml') |
Beta Was this translation helpful? Give feedback.
-
|
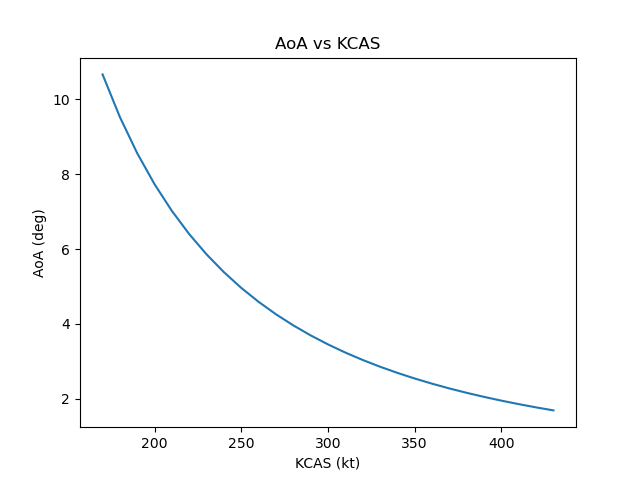
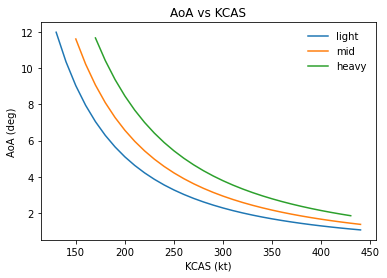
This is a simple curve with three weights.
import jsbsim
import matplotlib.pyplot as plt
import xml.etree.ElementTree as ET

# Open original file

def weightCG(fuelx,payloadx):
    tree = ET.parse('global5000.xml')
    root = tree.getroot()

    # finding the state tag and their child attributes.
    for x in root.findall('mass_balance'):
        x.find('emptywt').text='     48235 '

    for x in root.findall('mass_balance/pointmass'):
        x.find('weight').text=str(payloadx)

    for x in root.findall('propulsion/tank'):
        x.find('contents').text=str(fuelx)

    tree.write('global5000.xml')

    return

fuelmax=8097.63
fig, ax = plt.subplots()
payload=[1500,15172/2,15172]
fuel=[1000,fuelmax/2,fuelmax]
weight=["light","mid","heavy"]

for i in range(3):
    results = []
    weightCG(fuel[i],payload[i])
    fdm = jsbsim.FGFDMExec('.')
    fdm.load_model('global5000')
    # Set engines running
    fdm['propulsion/engine[0]/set-running'] = 1
    fdm['propulsion/engine[1]/set-running'] = 1
    for speed in range(120, 460, 10):
        fdm['ic/h-sl-ft'] = 250
        fdm['ic/vc-kts'] = speed
        fdm['ic/gamma-deg'] = 0

        fdm.run_ic() # Initialize the aircraft with initial conditions
        fdm.run()

        # Trim
        try:
            fdm['simulation/do_simple_trim'] = 1
            results.append((fdm['velocities/vc-kts'], fdm['aero/alpha-deg']))
        except RuntimeError as e:
            # The trim cannot succeed. Just make sure that the raised exception
            # is due to the trim failure otherwise rethrow.
            if e.args[0] != 'Trim Failed':
                raise

    for result in results:
        print(result[0], result[1])

    speed, alpha = zip(*results)
    plt.plot(speed, alpha,label=weight[i])

plt.legend(frameon=False)
plt.xlabel('KCAS (kt)')
plt.ylabel('AoA (deg)')
plt.title('AoA vs KCAS')

plt.show() |
Beta Was this translation helpful? Give feedback.
-
|
Rather than altering the XML file to modify the CG & weight, you could modify the properties for i in range(3):
results = []
- weightCG(fuel[i],payload[i])
fdm = jsbsim.FGFDMExec('.')
fdm.load_model('global5000')
+ # Update CG & weight
+ fdm['propulsion/tank[0]/contents-lbs`] = fuel[i]
+ fdm['inertia/pointmass-weight-lbs[0]`] = payload[i]
# Set engines running
fdm['propulsion/engine[0]/set-running'] = 1
fdm['propulsion/engine[1]/set-running'] = 1
for speed in range(120, 460, 10):
fdm['ic/h-sl-ft'] = 250
fdm['ic/vc-kts'] = speed
fdm['ic/gamma-deg'] = 0
fdm.run_ic() # Initialize the aircraft with initial conditions
fdm.run()Your method is perfectly fine however it leaves an altered XML aircraft definition file on your disk drive after the script has completed its execution. This can be the cause of some head scratching if you forget that fact later on (at least this happened to myself countless times 😉) |
Beta Was this translation helpful? Give feedback.
-
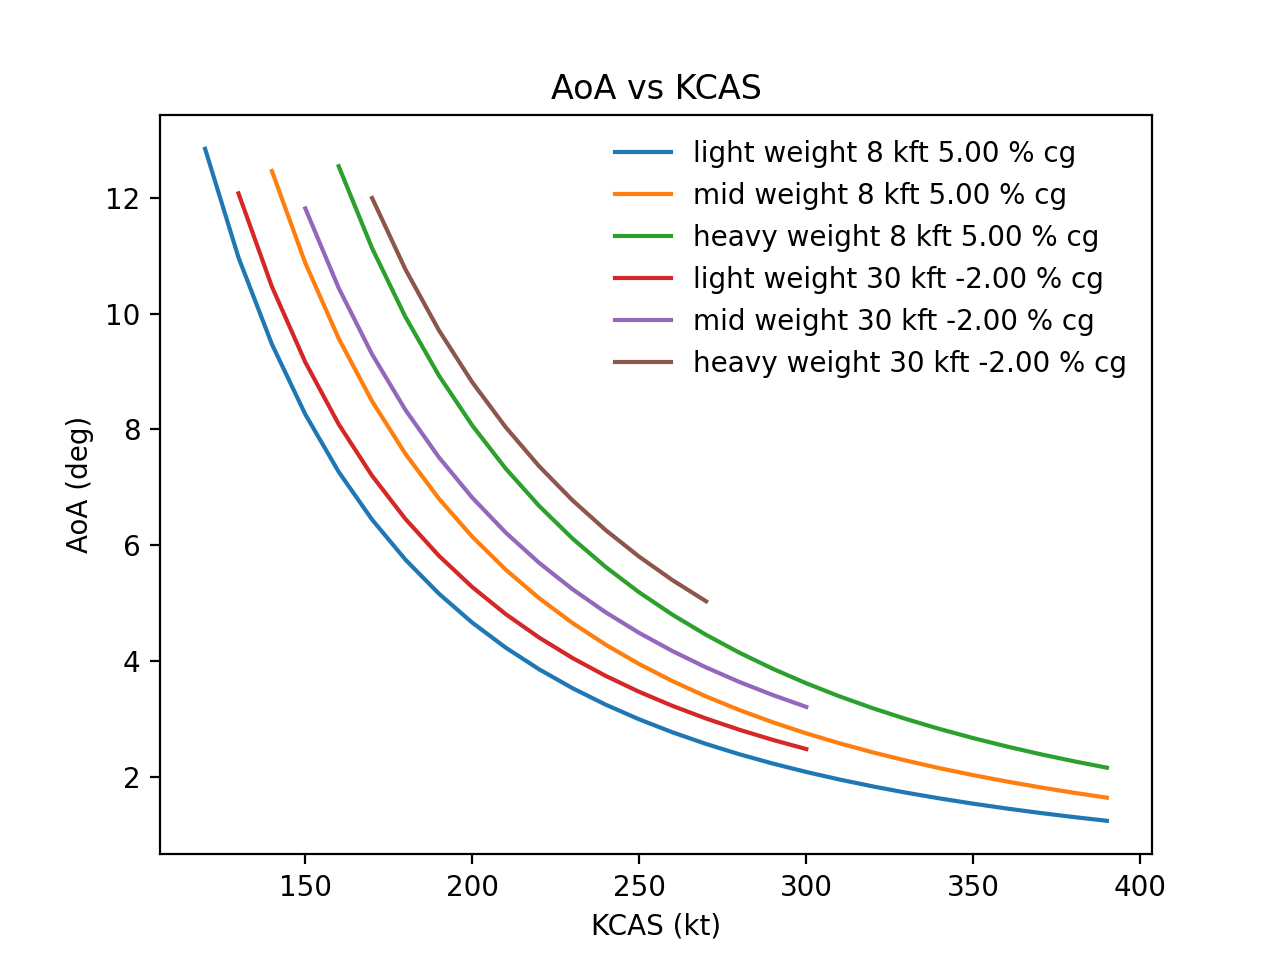
|
The final script. import jsbsim
from IPython.core.display import display, HTML
import xml.etree.ElementTree as ET
import matplotlib.pyplot as plt
def changeCG(cgPos,readOnly):
tree = ET.parse('global5000.xml')
root = tree.getroot()
for x in root.findall('mass_balance/location'):
cg = x.find('x').text
if not readOnly:
x.find('x').text=str(cgPos)
tree.write('global5000.xml')
return cg
fuelmax=8097.63
fig, ax = plt.subplots()
payload=[1500,15172/2,15172]
fuel=[1000,fuelmax/2,fuelmax]
weight=["light","mid","heavy"]
cgOrig=float(changeCG(0,True))
cgPos=[cgOrig*1.05,cgOrig*0.98]
h_ft=[8000,30000]
for j in range(2):
cg=changeCG(cgPos[j],False)
fdm = jsbsim.FGFDMExec('../../')
fdm.load_model('global5000')
# Set engines running
fdm['propulsion/engine[0]/set-running'] = 1
fdm['propulsion/engine[1]/set-running'] = 1
for i in range(3):
results = []
for speed in range(90, 460, 10):
fdm['ic/h-sl-ft'] = h_ft[j]
fdm['ic/vc-kts'] = speed
fdm['ic/gamma-deg'] = 0
fdm['propulsion/tank[0]/contents-lbs'] = fuel[i]
fdm['propulsion/tank[1]/contents-lbs'] = fuel[i]
fdm['propulsion/tank[2]/contents-lbs'] = fuel[i]
fdm['inertia/pointmass-weight-lbs[0]'] = payload[i]
fdm['inertia/mass_balance-positionx-in'] = cgPos[j]
fdm.run_ic() # Initialize the aircraft with initial conditions
fdm.run()
# Trim
try:
fdm['simulation/do_simple_trim'] = 1
results.append((fdm['velocities/vc-kts'], fdm['aero/alpha-deg']))
except RuntimeError as e:
# The trim cannot succeed. Just make sure that the raised exception
# is due to the trim failure otherwise rethrow.
if e.args[0] != 'Trim Failed':
raise
print("-----------------------------------------")
print("Altitude {} - Weight {} - CG {}".format(h_ft[j],weight[i],cgPos[j]))
print("-----------------------------------------")
for result in results:
print(result[0], result[1])
speed, alpha = zip(*results)
plt.plot(speed, alpha,label="{0} weight {1:.0f} kft {2:.2f} % cg".format(weight[i],h_ft[j]/1000,(float(cgPos[j])/float(cgOrig)-1)*100))
plt.legend(frameon=False)
plt.xlabel('KCAS (kt)')
plt.ylabel('AoA (deg)')
plt.title('AoA vs KCAS')
plt.show()
cgx=changeCG(str(cgOrig),False) |
Beta Was this translation helpful? Give feedback.
-
|
The intention is to have a maximum variation of AoA given a airspeed during leveled flight |
Beta Was this translation helpful? Give feedback.
-
|
Hi,
Yes, changing the xml is not the way to do. It can cause problems of
aircraft configuration. I was thinking to copy the file in the
beginning and copy again at the end to preserve it.
Your solution is much better and elegant. That is the way to do it.
Another question: what is the property to change in order to change CG?
Where can I find a list of properties? I tried to search for it but I
couldn't find it.
Regards,
Guilherme A. Lima da Silva
|
Beta Was this translation helpful? Give feedback.
-
The CG position is read only. The only means to modify the CG position is by altering the mass distribution as you did in your Python script. jsbsim/src/models/FGMassBalance.cpp Lines 399 to 404 in a35be5c
@seanmcleod provided some details about that topic in another discussion. In addition, you can query JSBSim to display properties details from your Python script using the method fdm = jsbsim.FGFDMExec('.')
fdm.load_script('scripts/c1721.xml')
print(fdm.query_property_catalog("")) # Provide an empty string to get the complete list of properties.
print(fdm.query_property_catalog("ic/")) # Print all the properties which name starts with 'ic/' i.e. initial conditions properties. |
Beta Was this translation helpful? Give feedback.
-
|
Nice..Thank you |
Beta Was this translation helpful? Give feedback.
-
|
Hi,
I implemented the python script to get AoA vs. KCAS by varying weight, CG
and altitude.
See in the post above the result. It is exactly what I am looking for.
If you would like to receive a PR, I will do it. Just let me know where to
place it.
Thank you very much.
Regards,
Guilherme A. Lima da Silva, Dr.
|
Beta Was this translation helpful? Give feedback.
-
|
Sure, that would be a nice contribution to the I would suggest to locate your file in |
Beta Was this translation helpful? Give feedback.
-
|
I did that but did not create a new python subdir... |
Beta Was this translation helpful? Give feedback.
-
|
How can I find the CG in terms of MAC? Is there any place where it defined the x coordinate of wing root? Or conversion of inches into MAC? |
Beta Was this translation helpful? Give feedback.
-
|
JSBSim does not request the wing root station nor is it supplied with the MAC so I'm afraid you'll have to compute the CG position in % MAC by your own means. That should not be to complicated since the CG position is given in the structural frame: once you know the wing root station in the same frame, it is only a matter of subtracting the two values and dividing by the MAC (which is constant since it only depends on the winfg geometry). |
Beta Was this translation helpful? Give feedback.
-
|
Ok I understand...we are doing a more advanced model with DATCOM Pro...the aeromatic was only a start point... |
Beta Was this translation helpful? Give feedback.
-
|
@gasilva @bcoconni for fun I took my original code and expanded the AoA envelope to encompass negative AoA and inverted flight. Also to double-check if the JSBSim trim routines would handle the inverted case. |
Beta Was this translation helpful? Give feedback.
-
|
WOW ! That is amazing. Very cool. |
Beta Was this translation helpful? Give feedback.
-
|
Nice post ! Very interesting and it's always heartwarming to see that JSBSim has its maths right 😄 |
Beta Was this translation helpful? Give feedback.
-
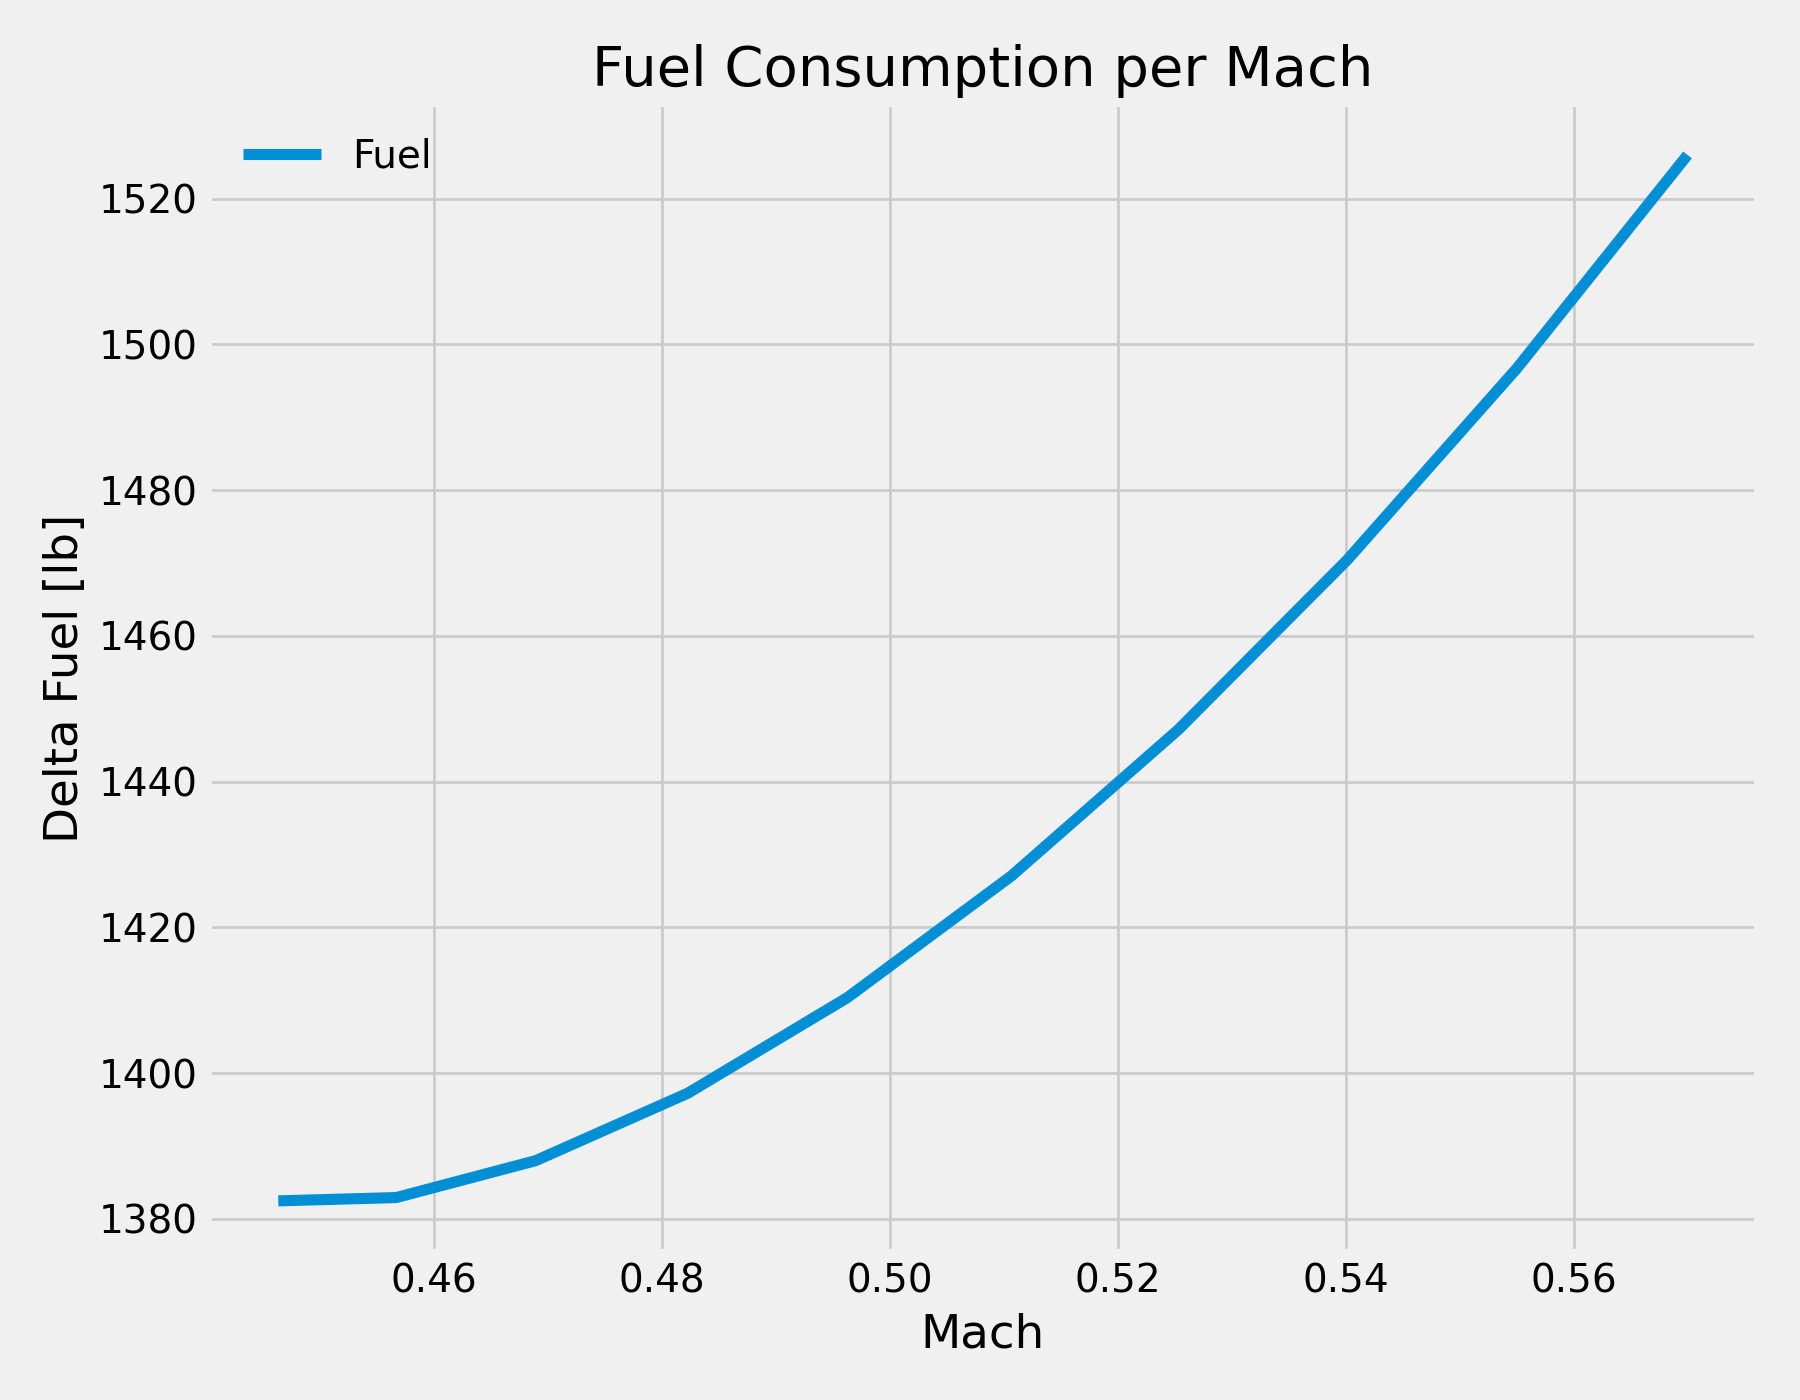
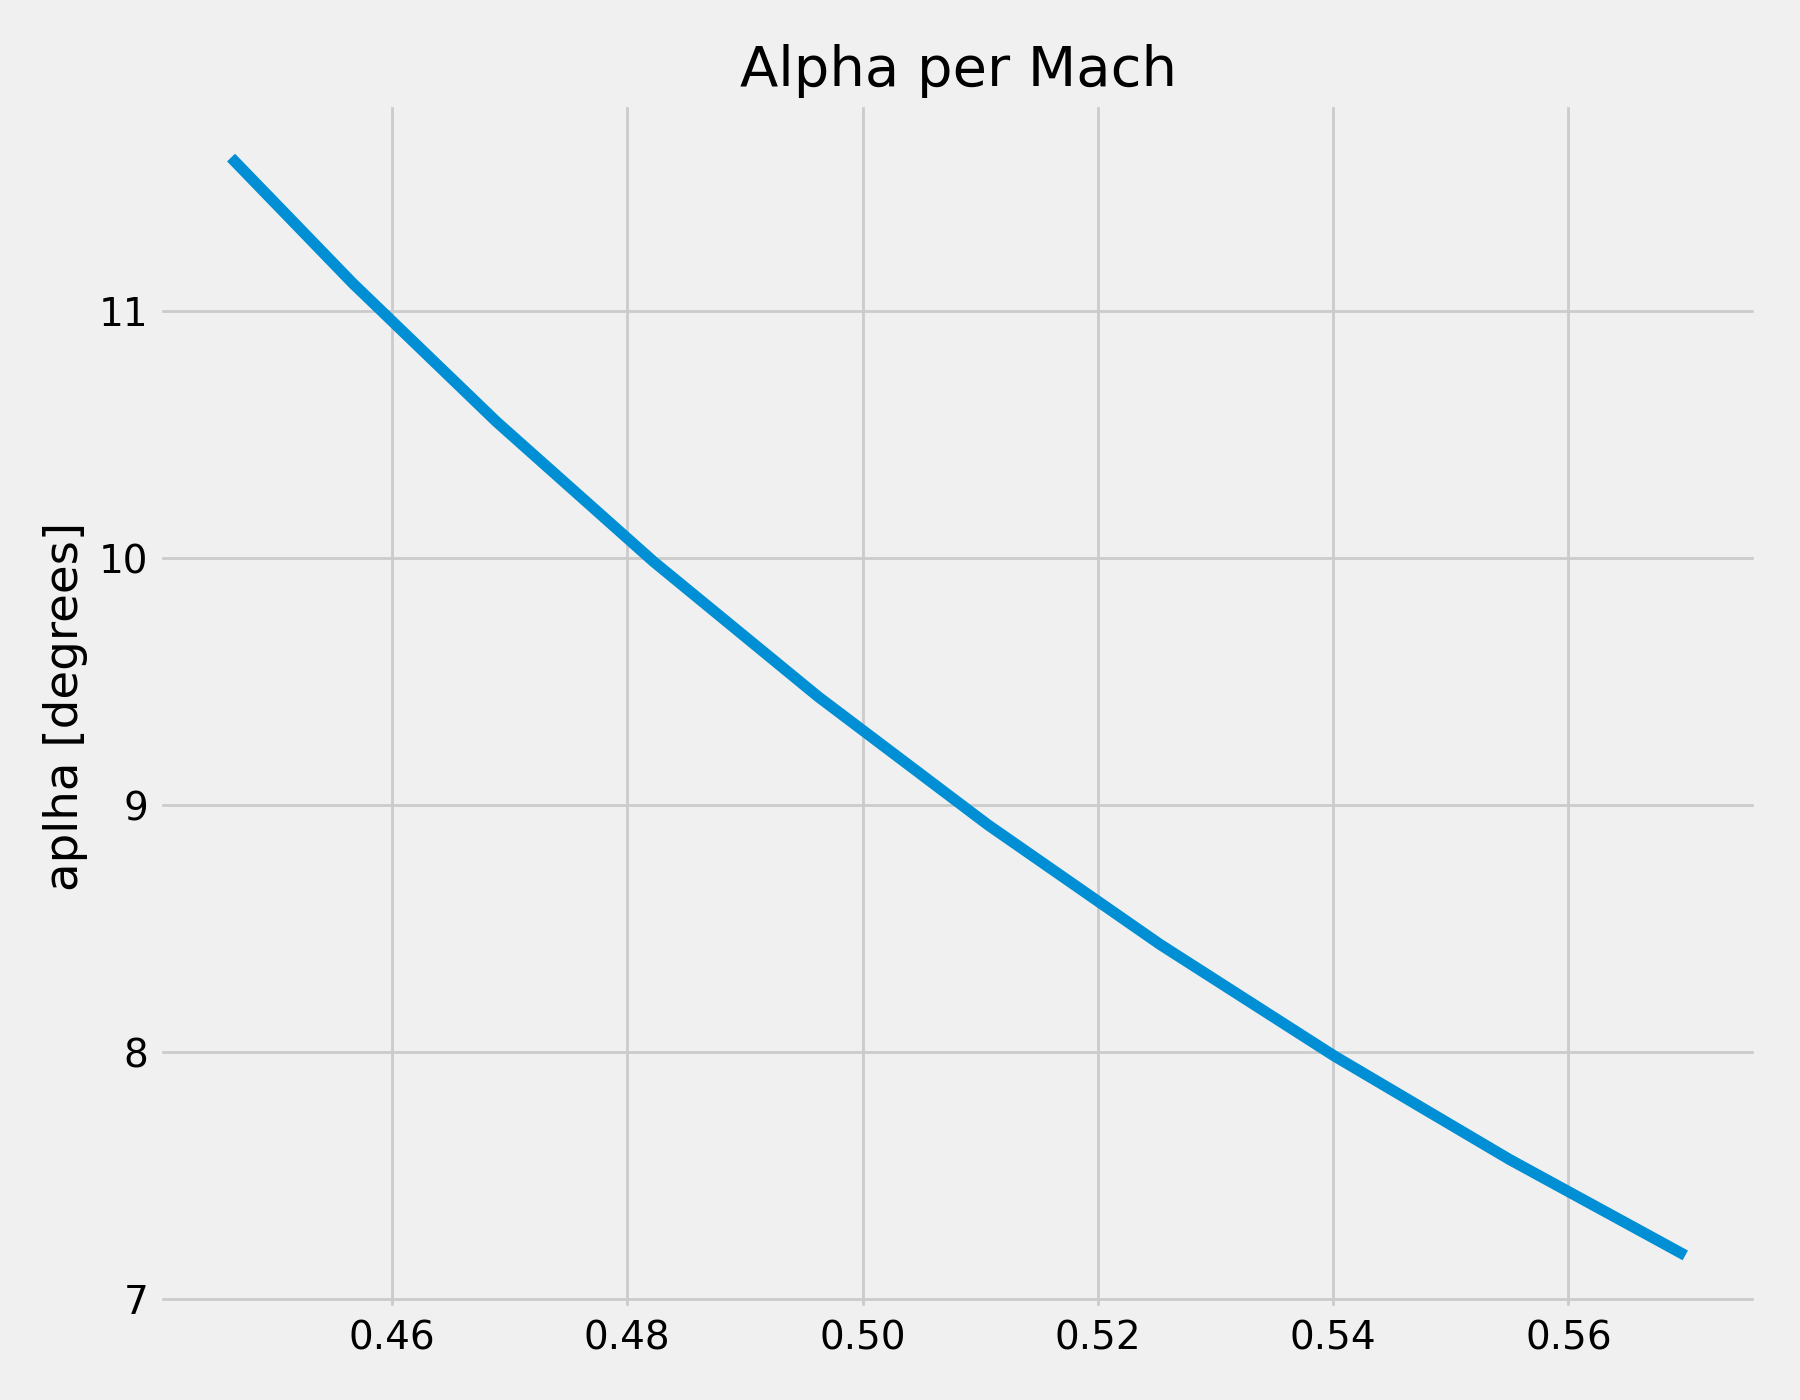
|
@seanmcleod yes the code below confirms that the optimum consumption is related to Mach number as you said before. Thank you for you note about the subject. The L/D max angle is 5.08 degrees according to calculations of FAA TC 18/7. But the 11.5 degrees result is close to alpha minimum power required, which is 14.8 degrees. By the way the 11.5 degrees is the highest possible angle since it is a leveled flight with no flaps at maximum weight and 30 kft. # Originally developed by JSBSim Team
# Modified by Guilherme A. L. da Silva - aerothermalsolutions.co
# Calculation required by aircraft icing enginering - fuel consumption
import jsbsim
import matplotlib.pyplot as plt
import matplotlib.style as style
style.use('fivethirtyeight')
results=[]
i=0
tank=[]
for j in range(10):
fdm = jsbsim.FGFDMExec('../../')
fdm.load_model('global5000')
# Set engines running
fdm['propulsion/engine[0]/set-running'] = 1
fdm['propulsion/engine[1]/set-running'] = 1
fdm['ic/h-sl-ft'] = 30000
fdm['ic/gamma-deg'] = 0
fdm['ap/alpha_hold']= 0
fdm['ap/altitude_hold']= 0
fdm['ic/vc-kts']=155+6*float(j)
tank0i=fdm["propulsion/tank[0]/contents-lbs"]
tank1i=fdm["propulsion/tank[1]/contents-lbs"]
tank2i=fdm["propulsion/tank[2]/contents-lbs"]
fdm.run_ic() # Initialize the aircraft with initial conditions
fdm.run()
# Trim
try:
fdm['simulation/do_simple_trim'] = 1
except RuntimeError as e:
if e.args[0] != 'Trim Failed':
raise
while fdm.run() and fdm.get_sim_time() <= 1000:
if fdm.get_sim_time()<1:
fdm['ap/alpha_hold']= 0
fdm['ap/altitude_setpoint']= 30000
fdm['ap/altitude_hold']= 1
fdm.run()
results.append((fdm['simulation/sim-time-sec'],fdm['velocities/vc-kts'], fdm['aero/alpha-deg'],fdm["propulsion/tank[0]/contents-lbs"],fdm["propulsion/tank[1]/contents-lbs"],fdm["propulsion/tank[2]/contents-lbs"]))
tank0f=fdm["propulsion/tank[0]/contents-lbs"]
tank1f=fdm["propulsion/tank[1]/contents-lbs"]
tank2f=fdm["propulsion/tank[2]/contents-lbs"]
deltaTank0=tank0i-tank0f
deltaTank1=tank1i-tank1f
deltaTank2=tank2i-tank2f
deltaTotal=deltaTank0+deltaTank2+deltaTank1
print("--------------------------------------")
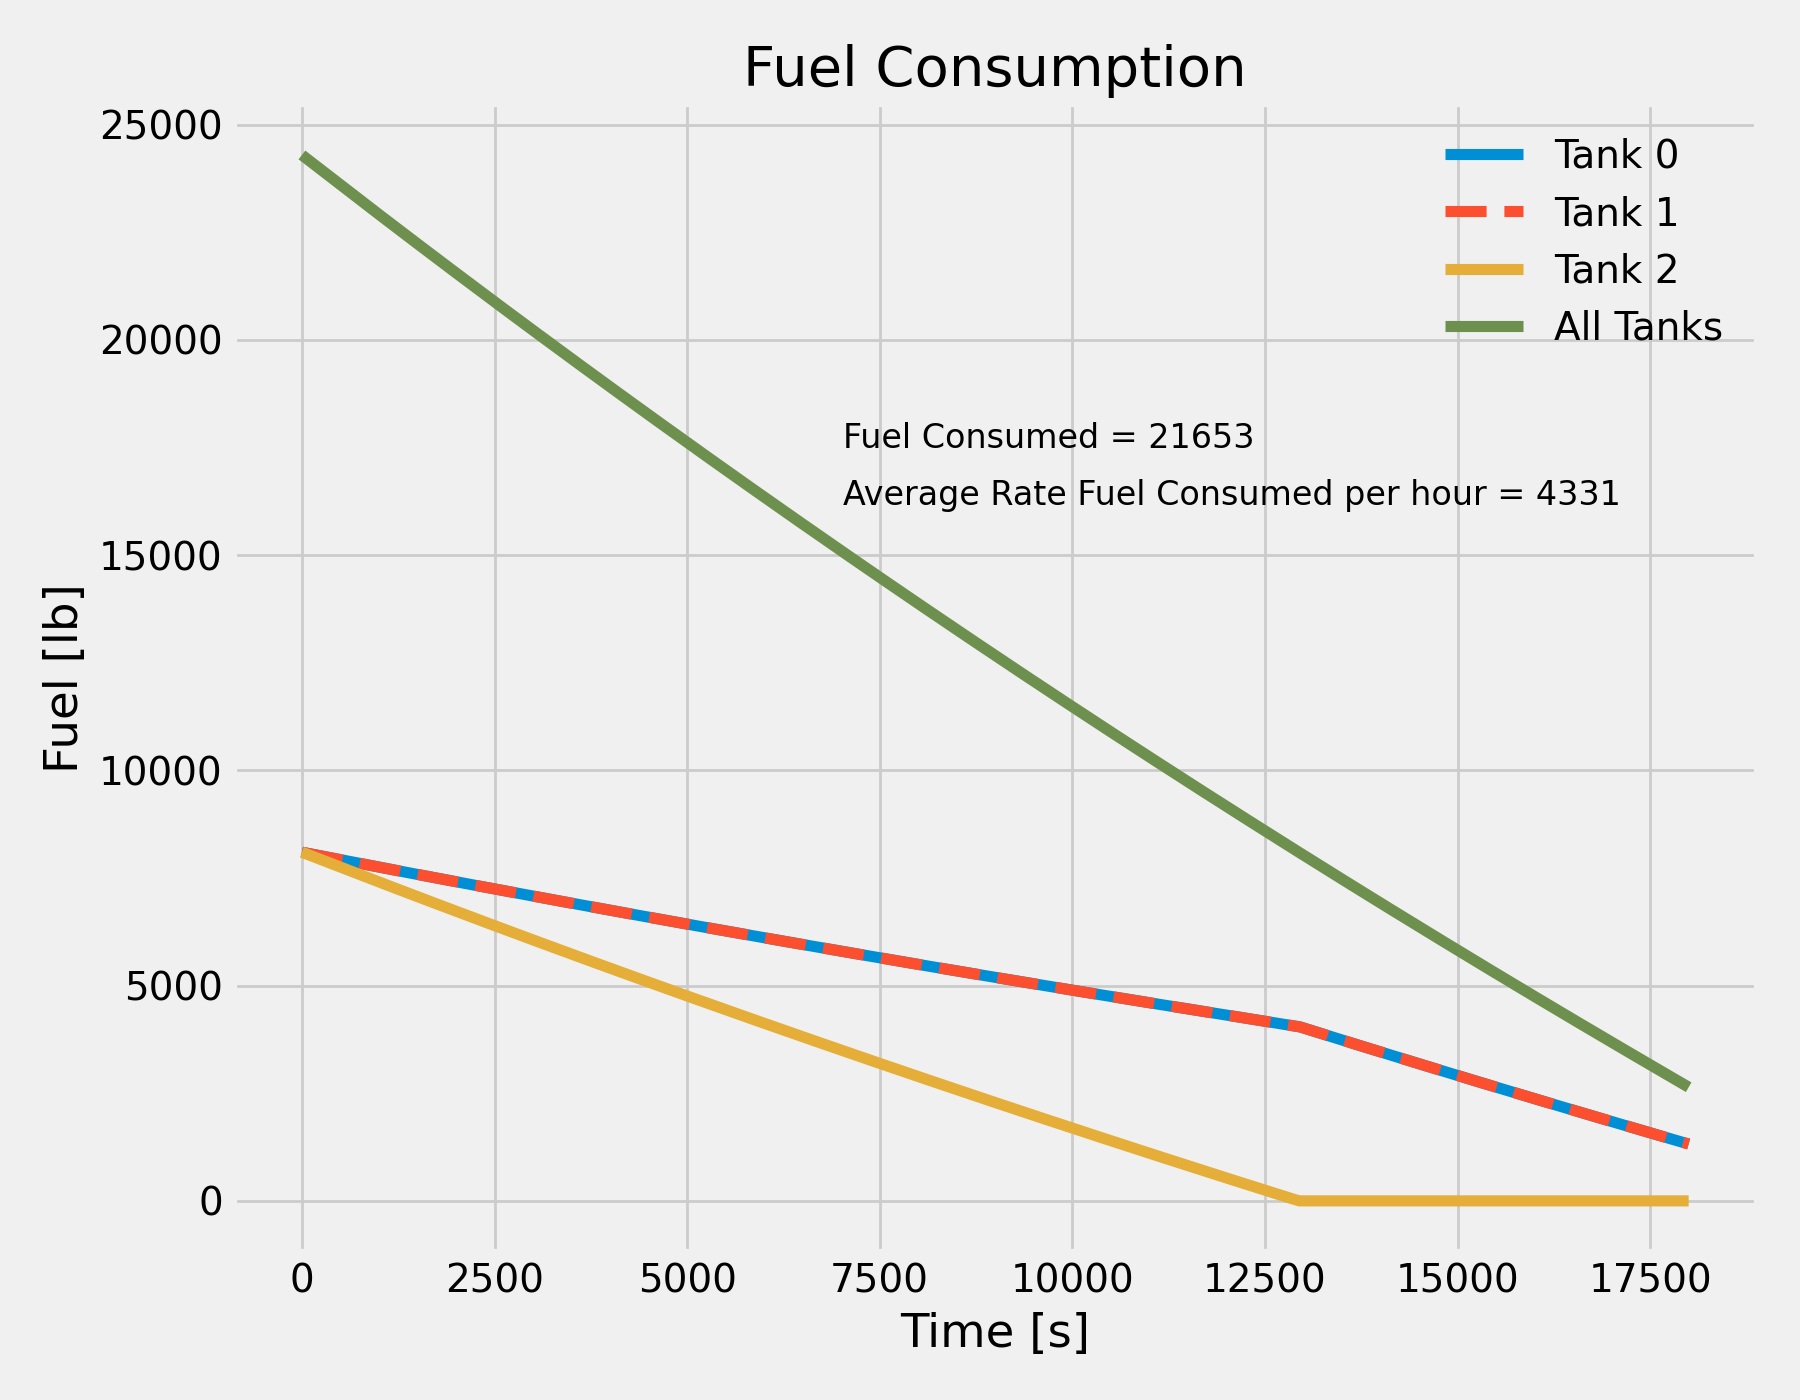
print("Fuel Consumed = {}".format(deltaTotal))
print("Average Rate Fuel Consumed per hour = {}".format(deltaTotal/(1600/3600)))
print("--------------------------------------")
tank.append((fdm['velocities/mach'],fdm['aero/alpha-deg'],fdm['ic/h-sl-ft'],deltaTotal))
time, speed, alpha, tank0, tank1, tank2 = zip(*results)
machPlot,alpha,altitude,deltaPlot = zip(*tank)
#prepare subplots to overlay plots
fig, ax = plt.subplots(figsize=(9,7))
plt.plot(machPlot[:], deltaPlot[:],'-',label="Fuel")
plt.legend(frameon=False)
plt.xlabel('Mach')
plt.ylabel('Delta Fuel [lb]')
plt.title('Fuel Consumption per Mach')
plt.tight_layout()
plt.show()
#prepare subplots to overlay plots
fig, ax = plt.subplots(figsize=(9,7))
plt.plot(machPlot[:], alpha[:],'-',label="AoA")
plt.ylabel('aplha [degrees]')
plt.title('Alpha per Mach')
plt.tight_layout()
plt.show()
#prepare subplots to overlay plots
fig, ax = plt.subplots(figsize=(9,7))
plt.plot(machPlot[:], altitude[:],'-',label="altitude")
plt.ylabel('Altitude [ft]')
plt.title('Altitude per Mach')
plt.tight_layout()
plt.show()
print(tank)
|
Beta Was this translation helpful? Give feedback.
-
|
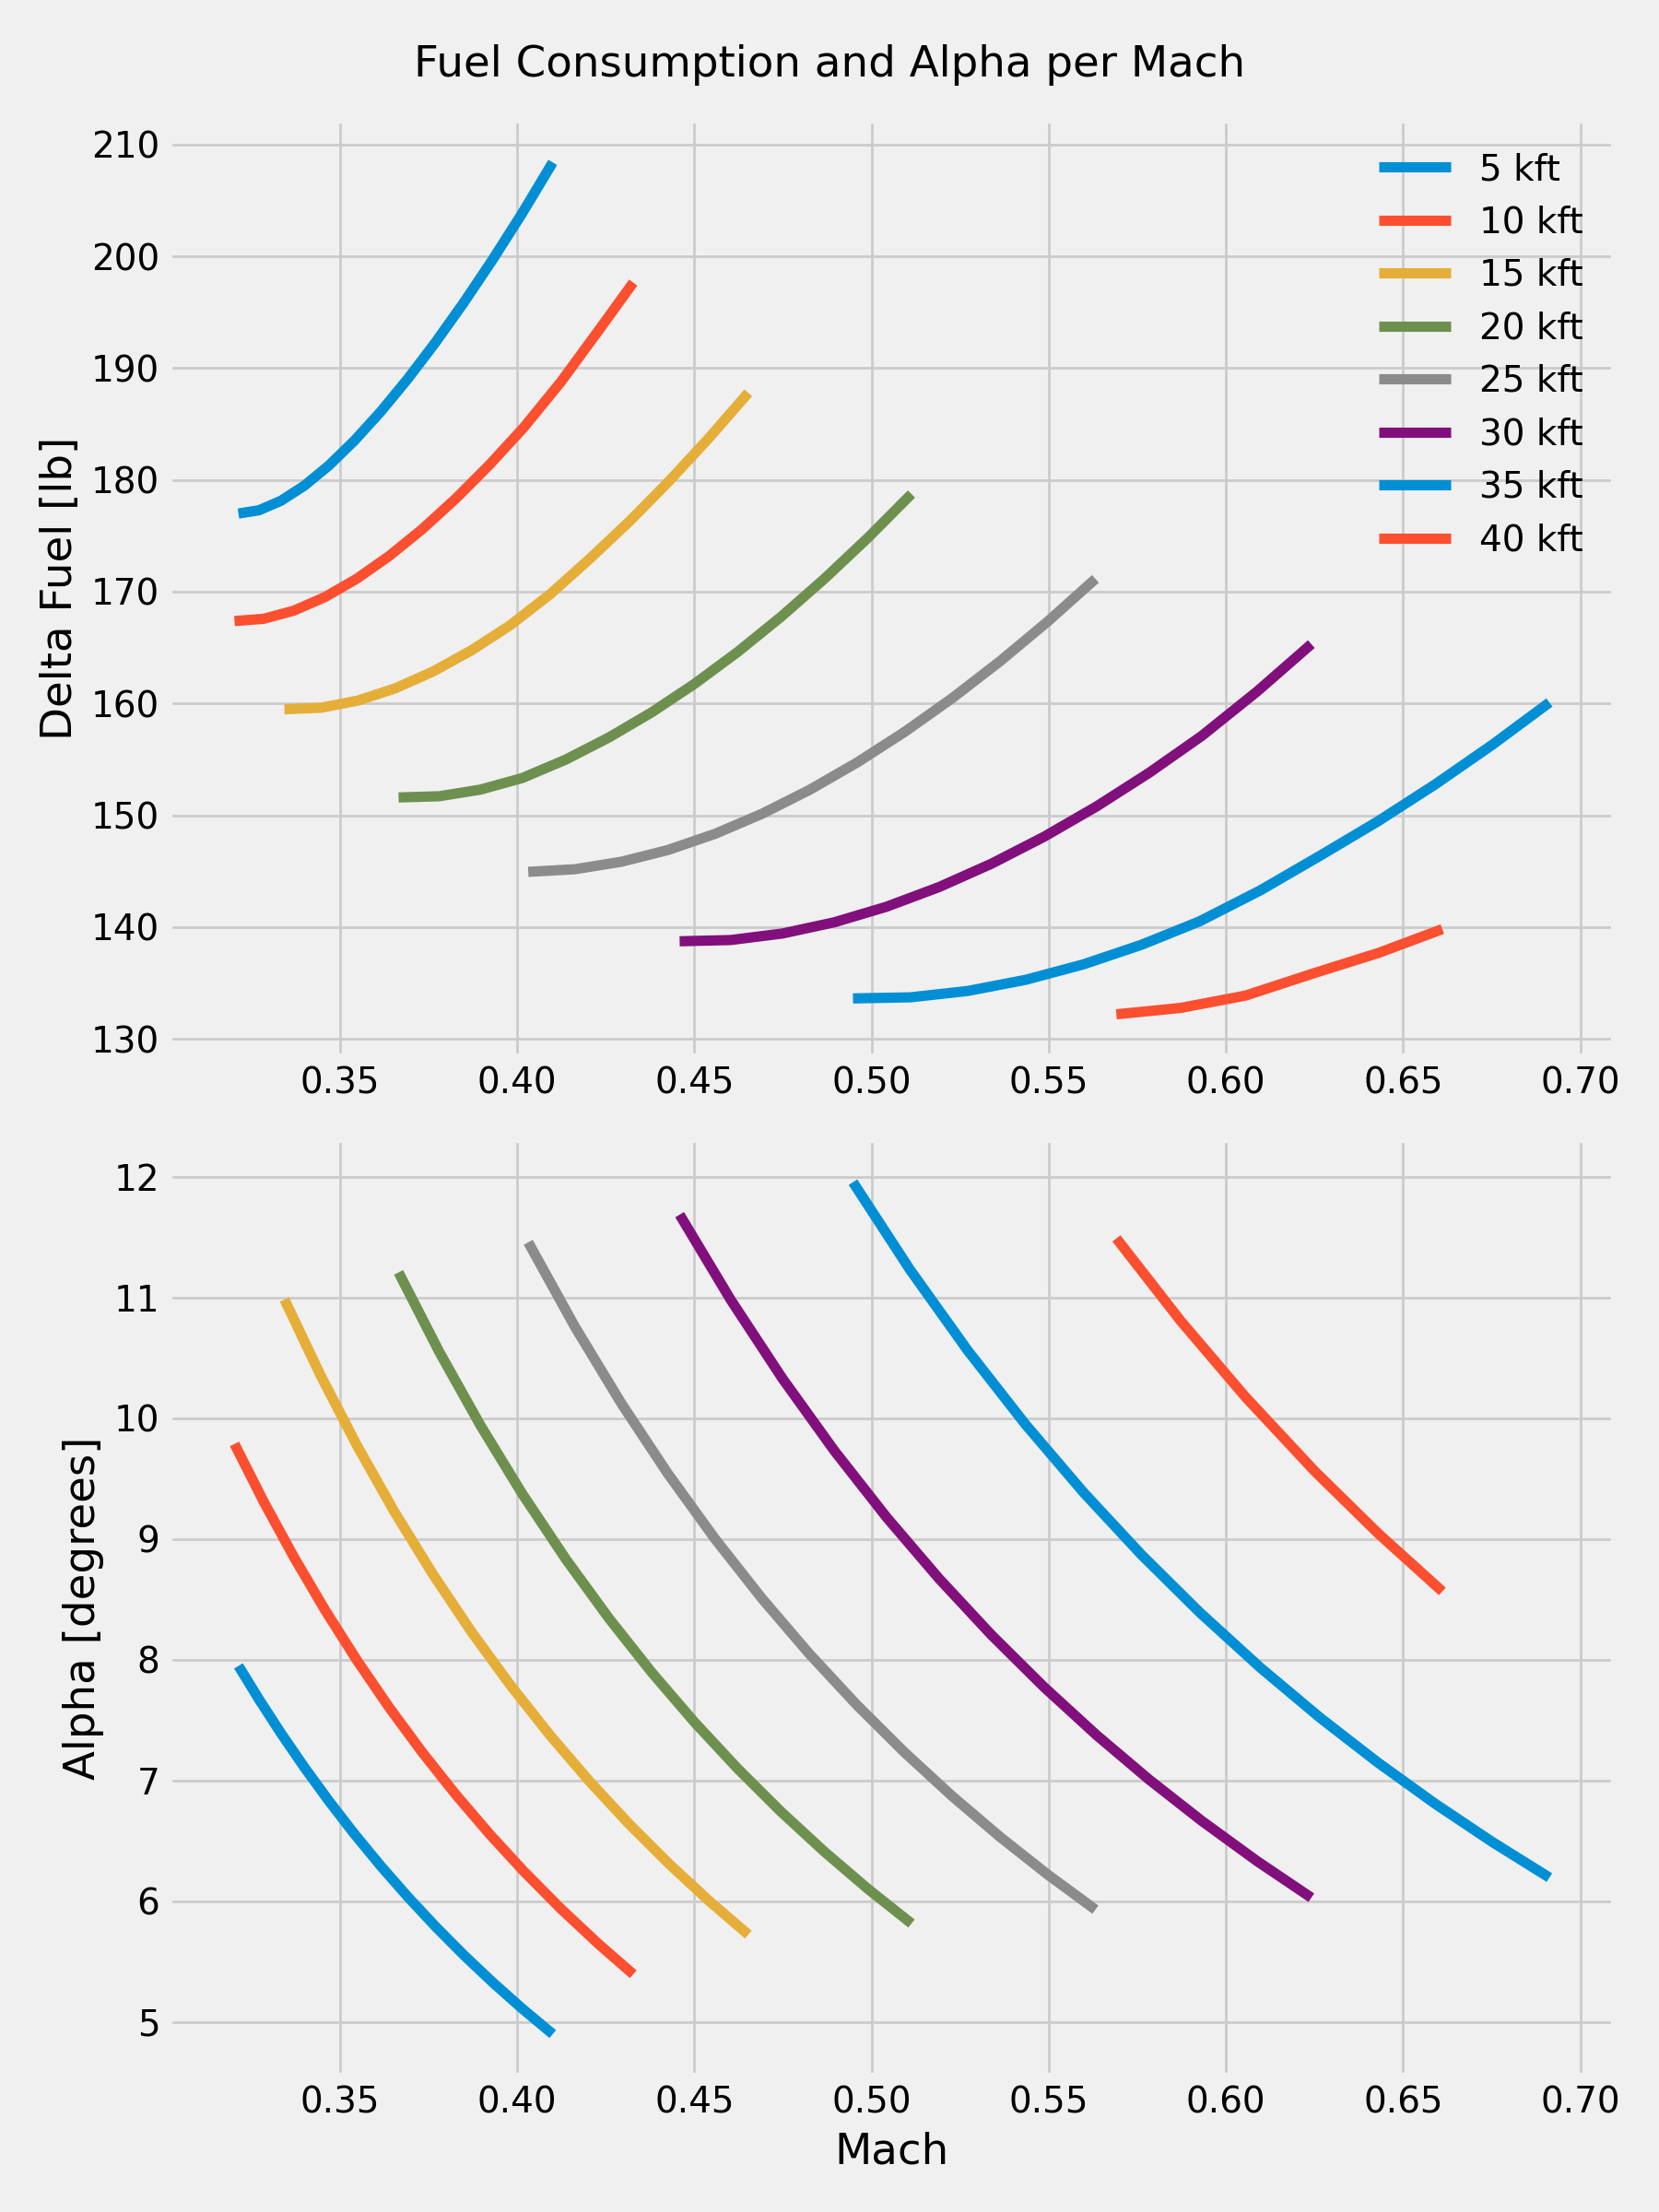
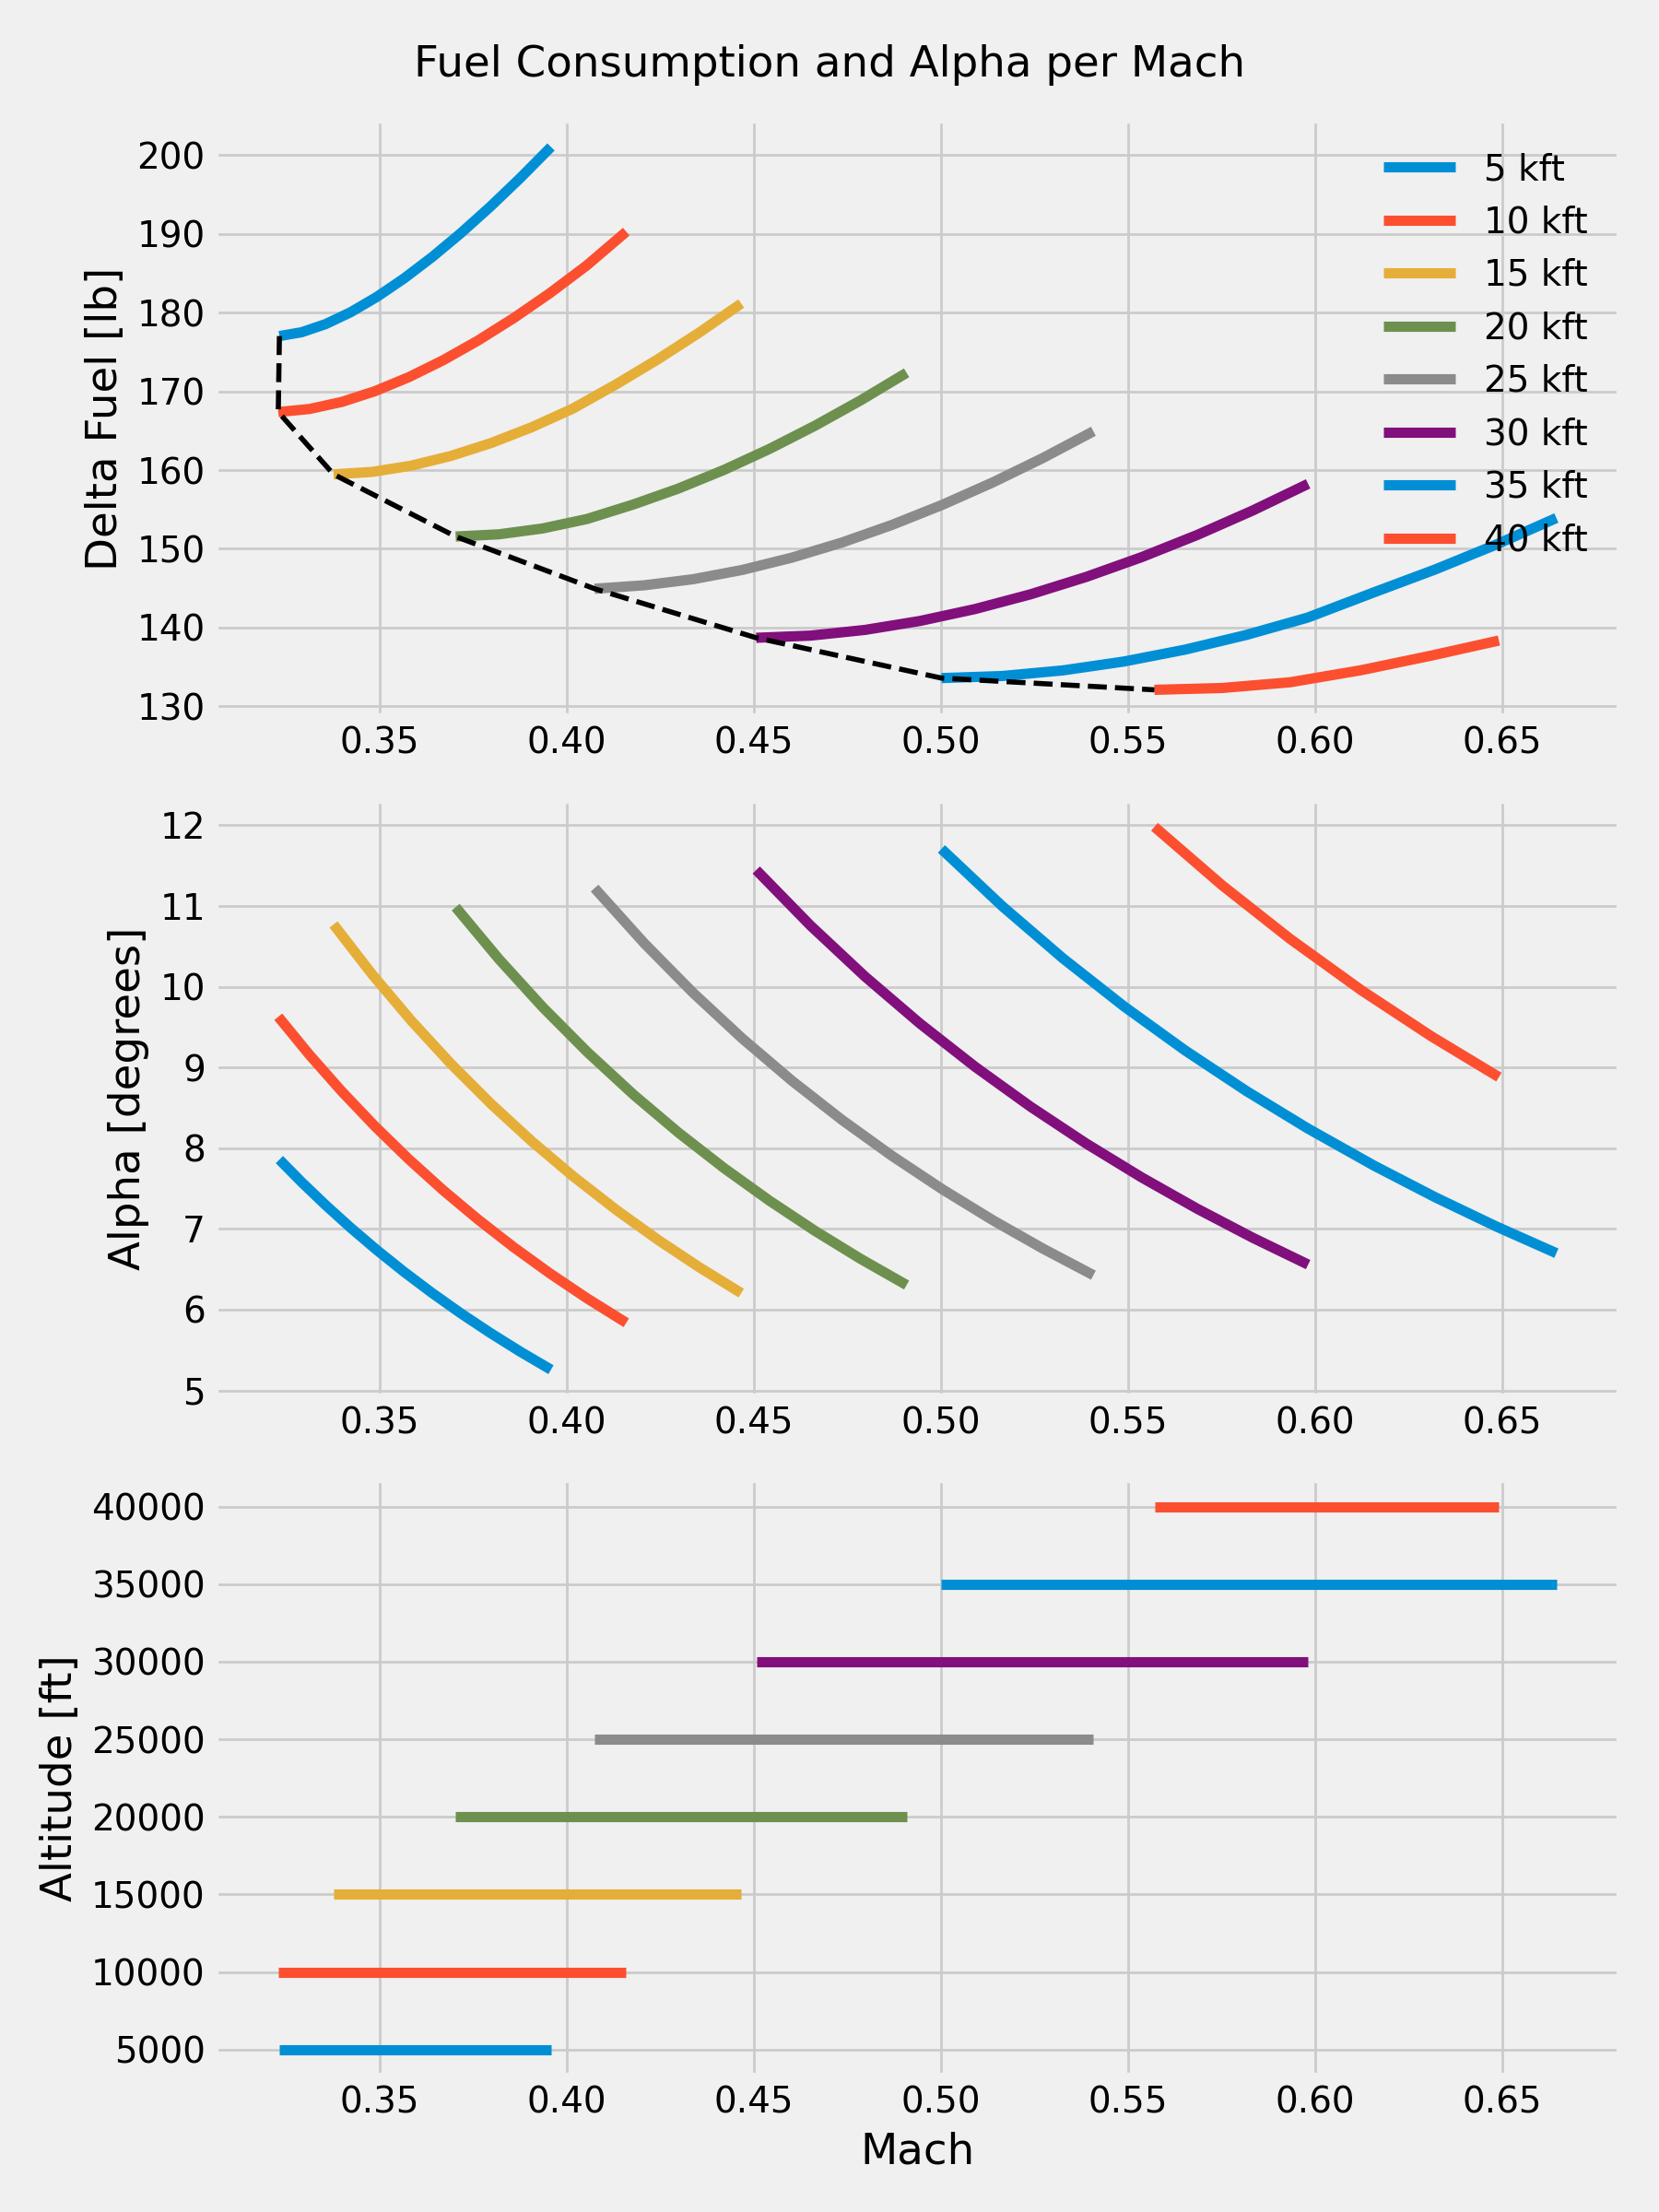
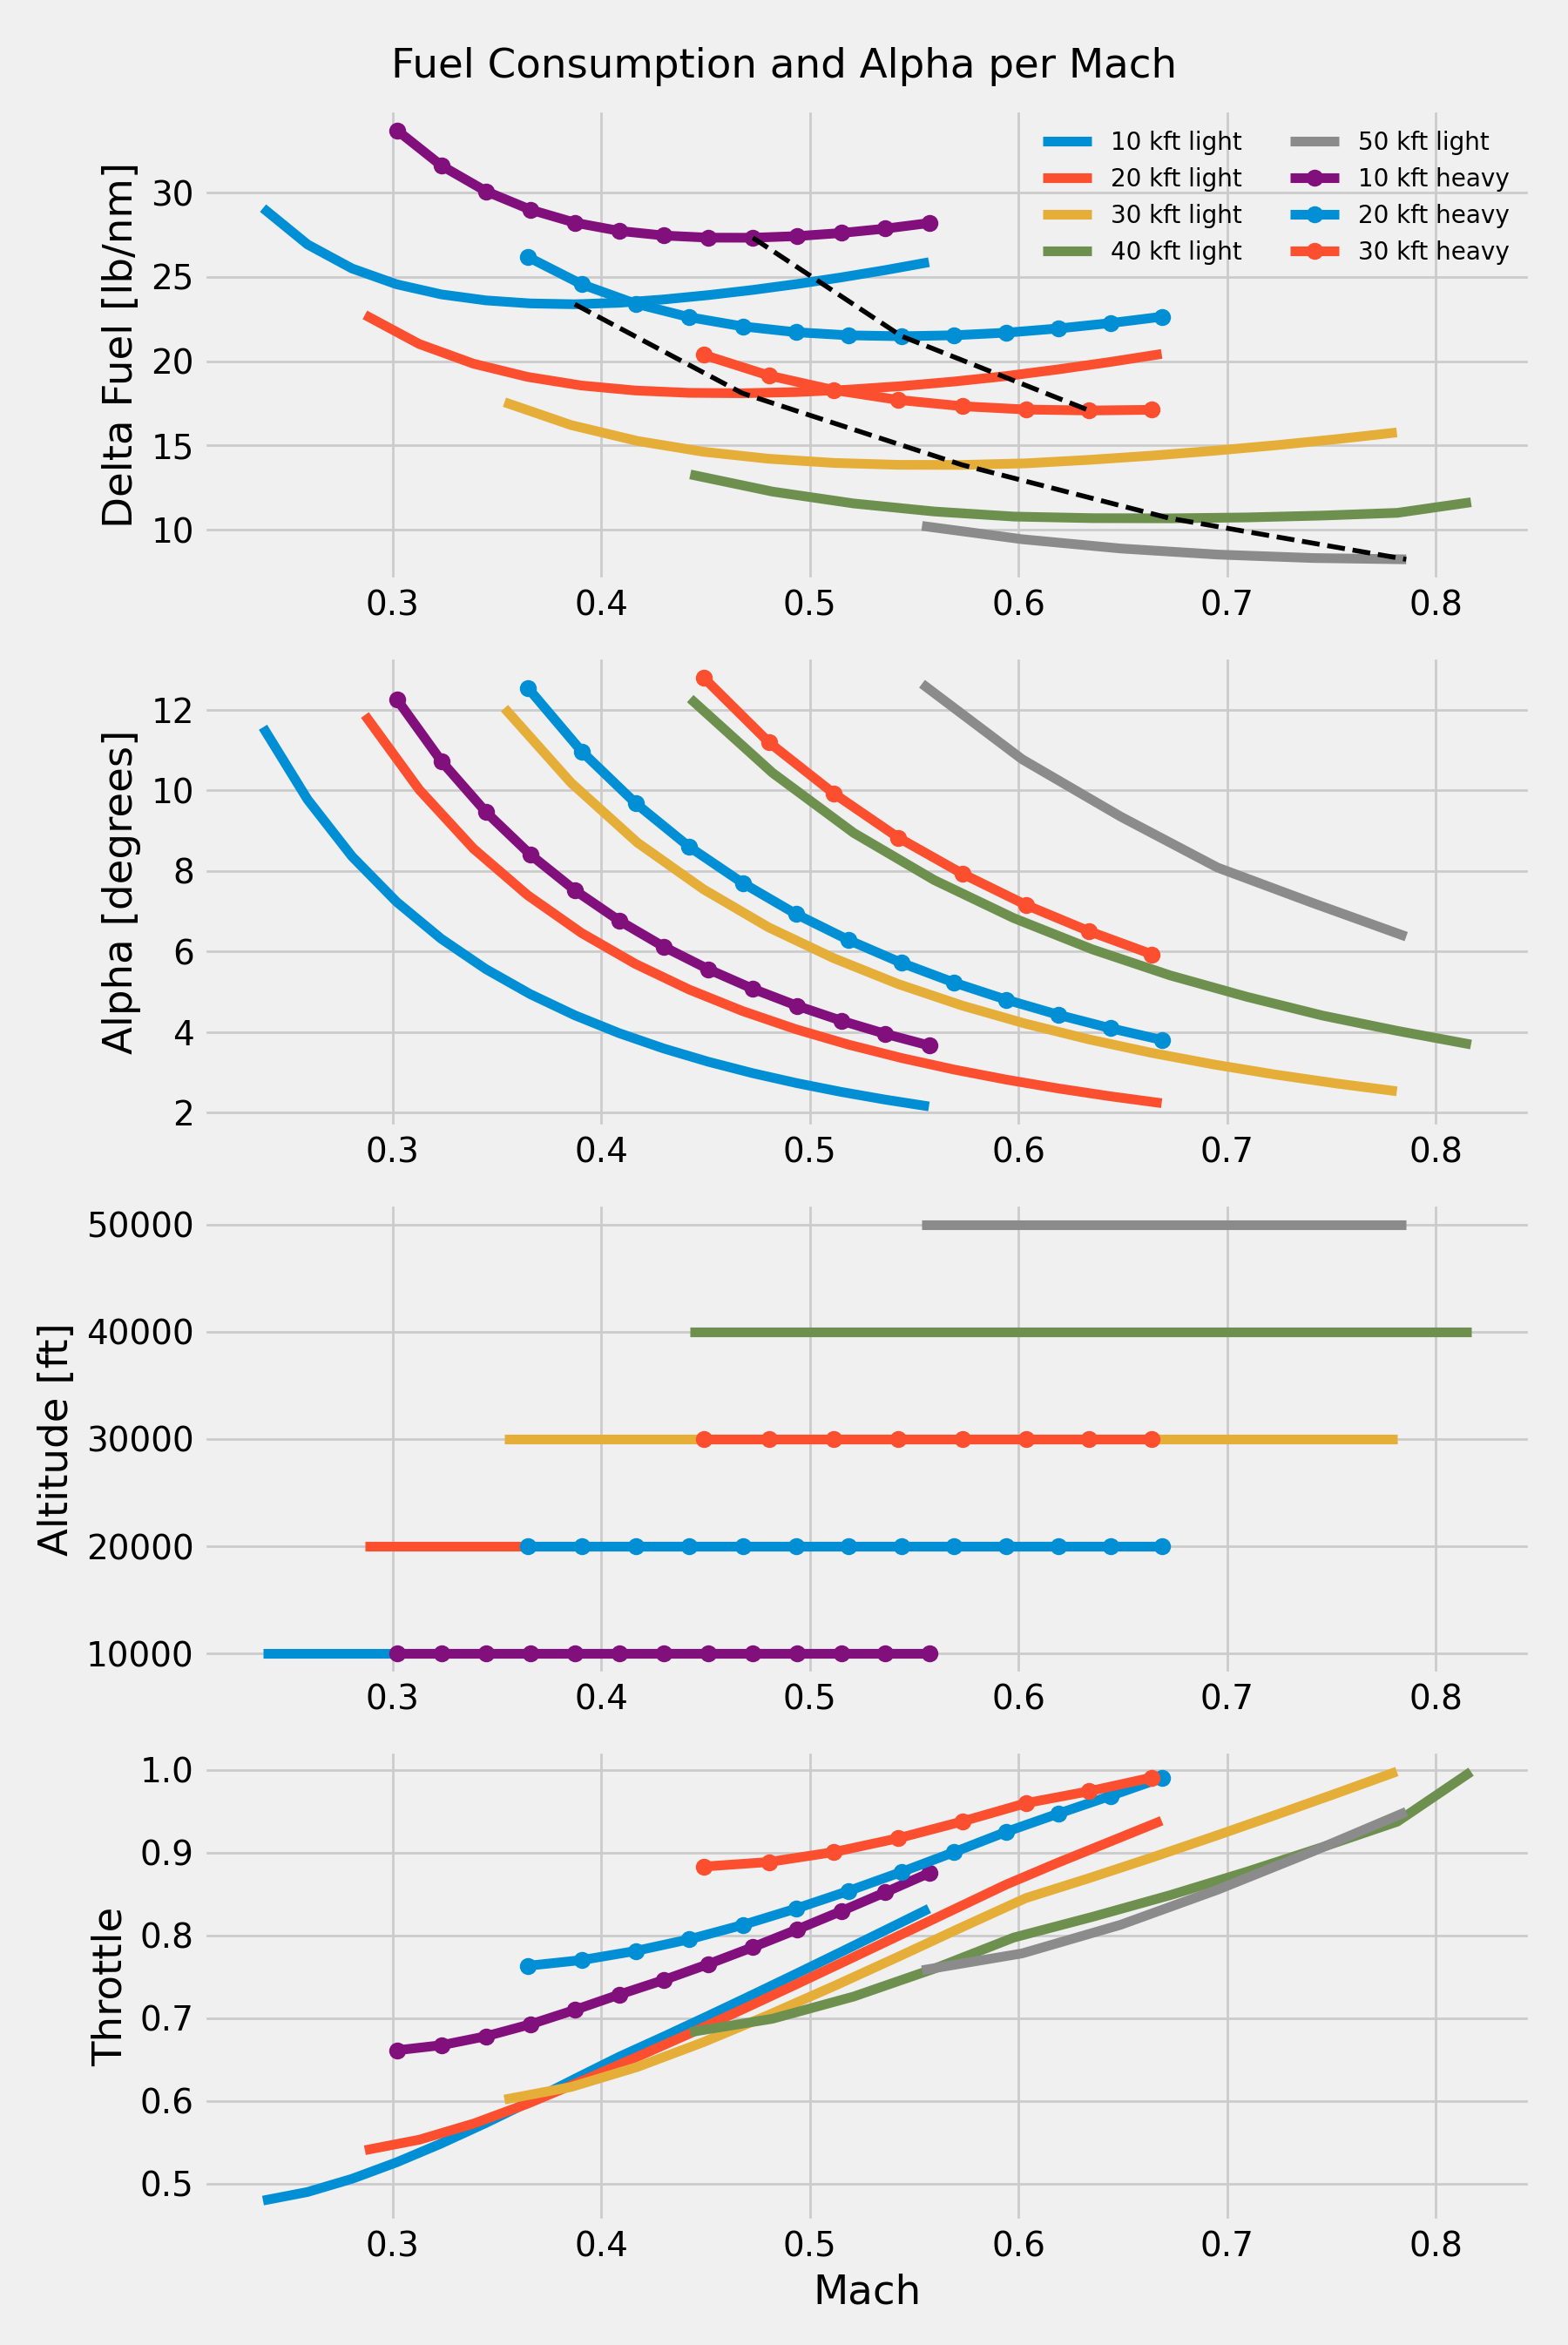
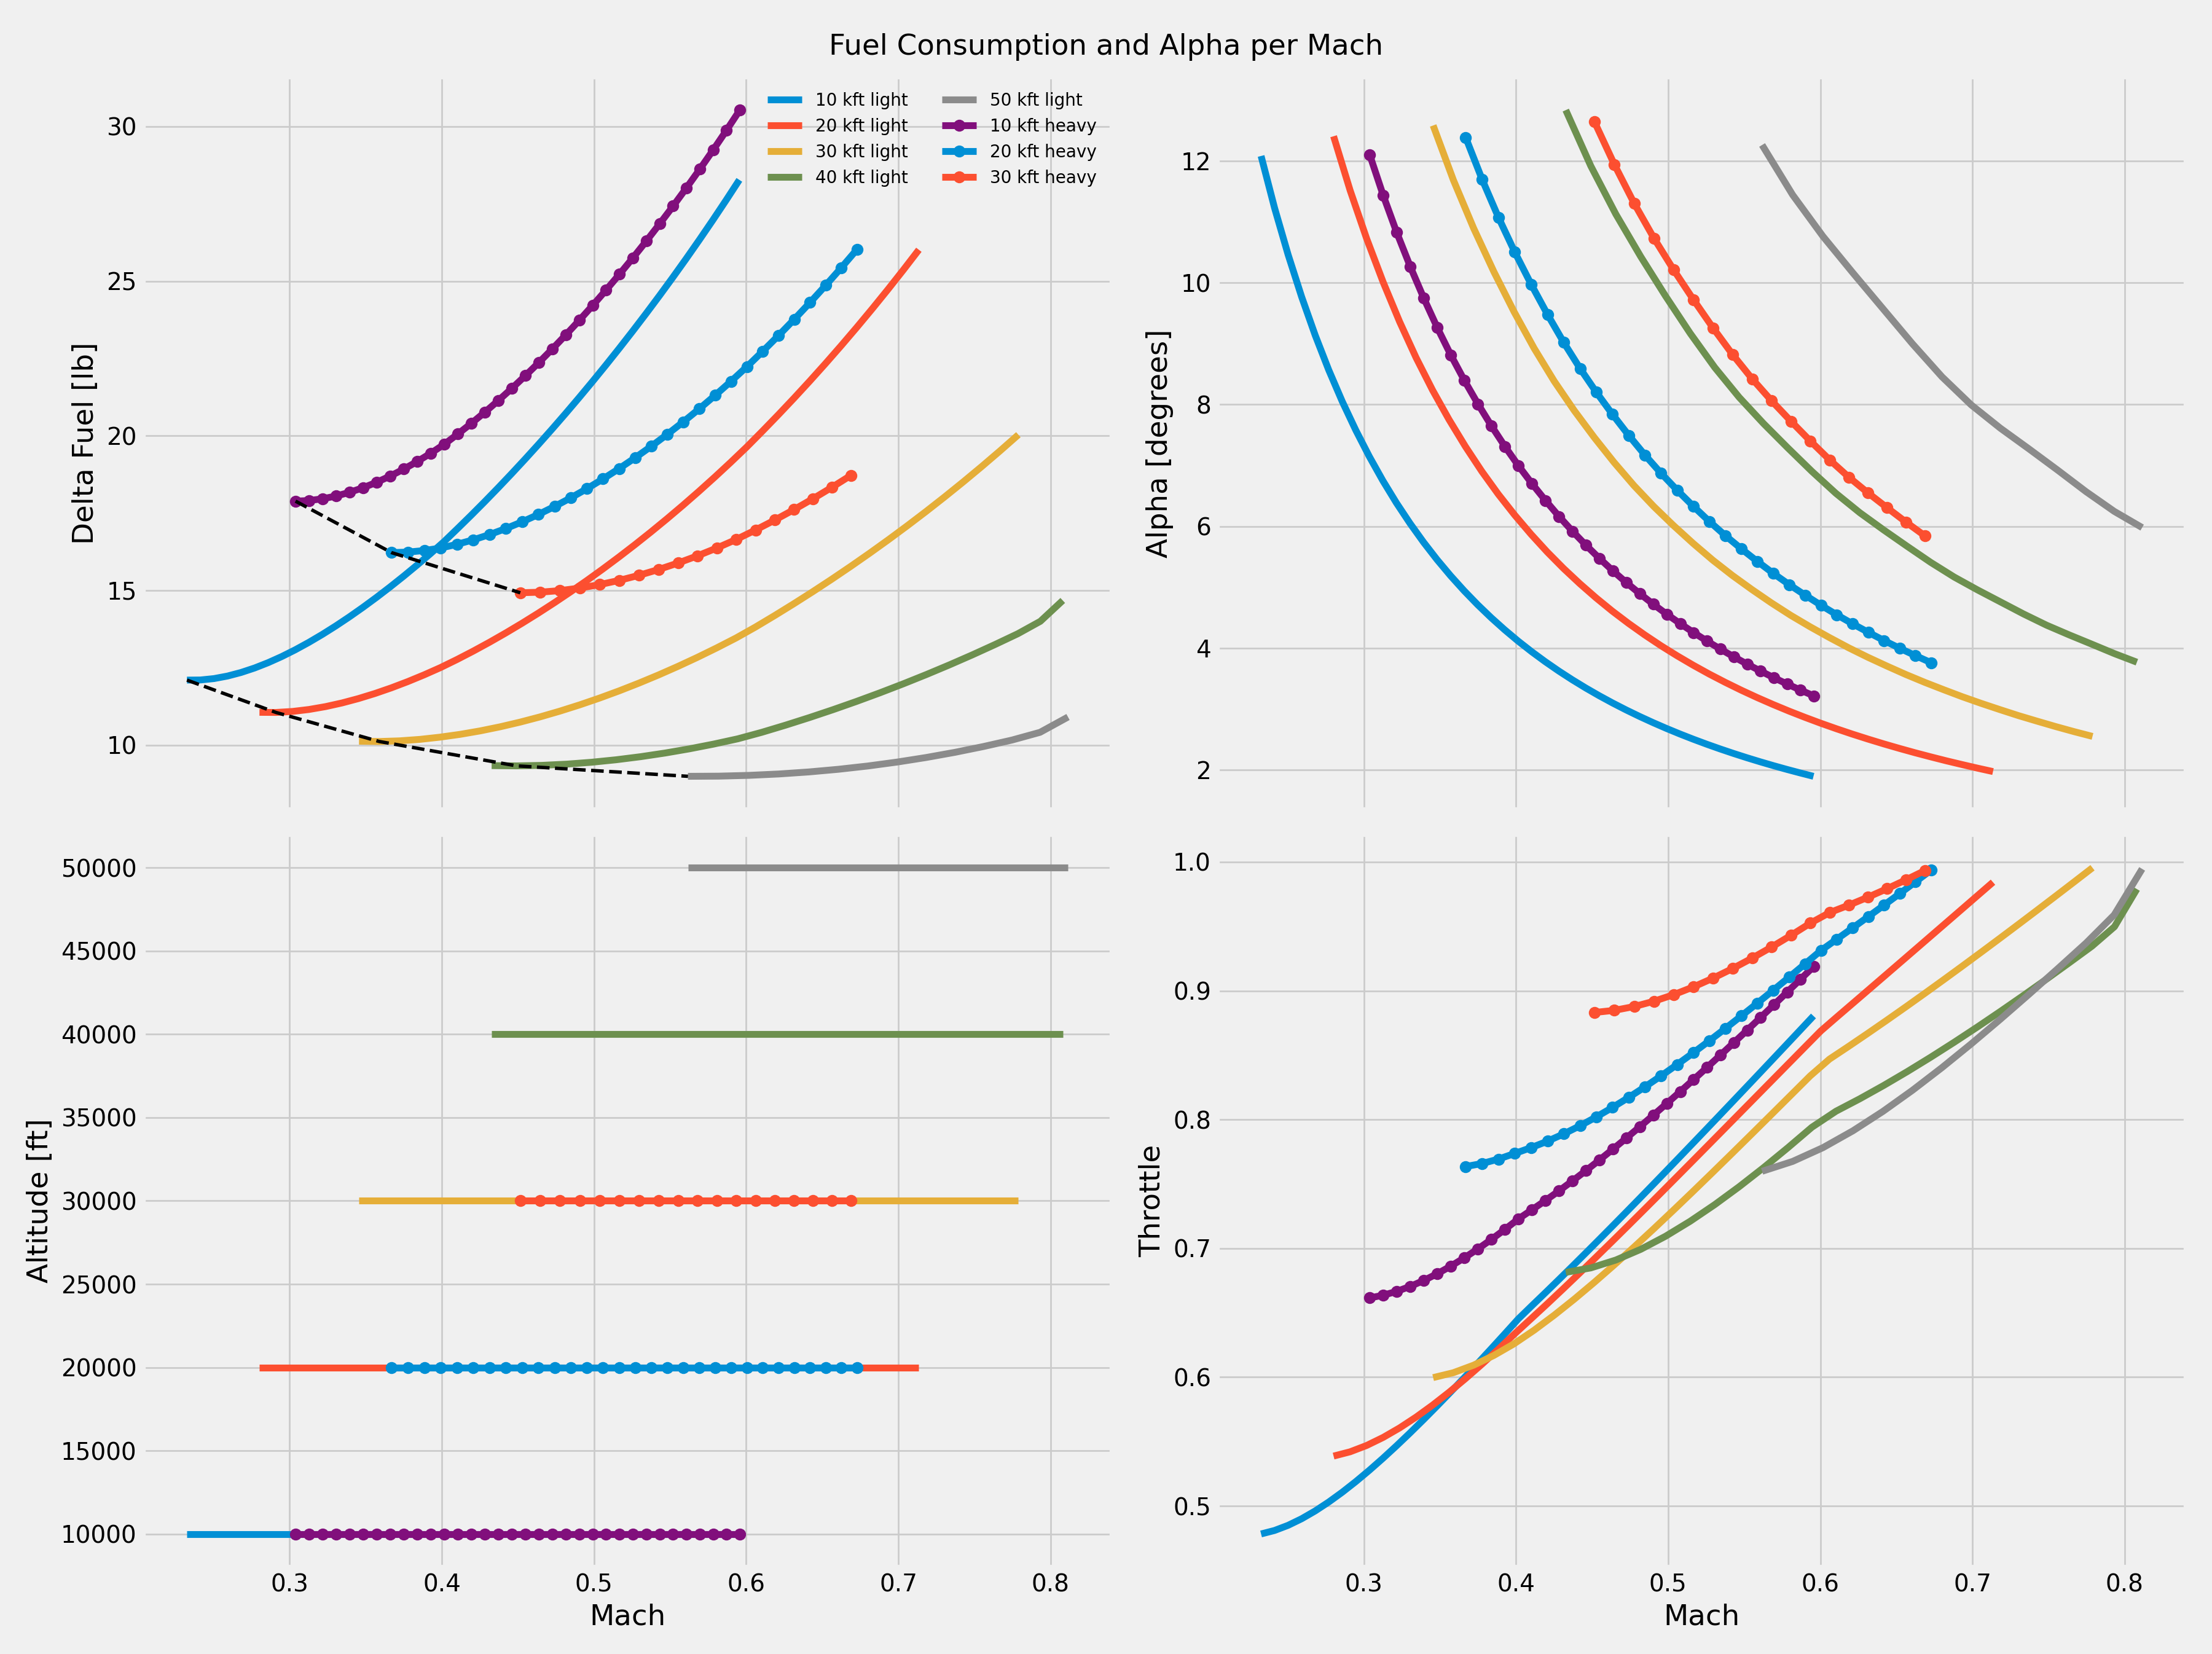
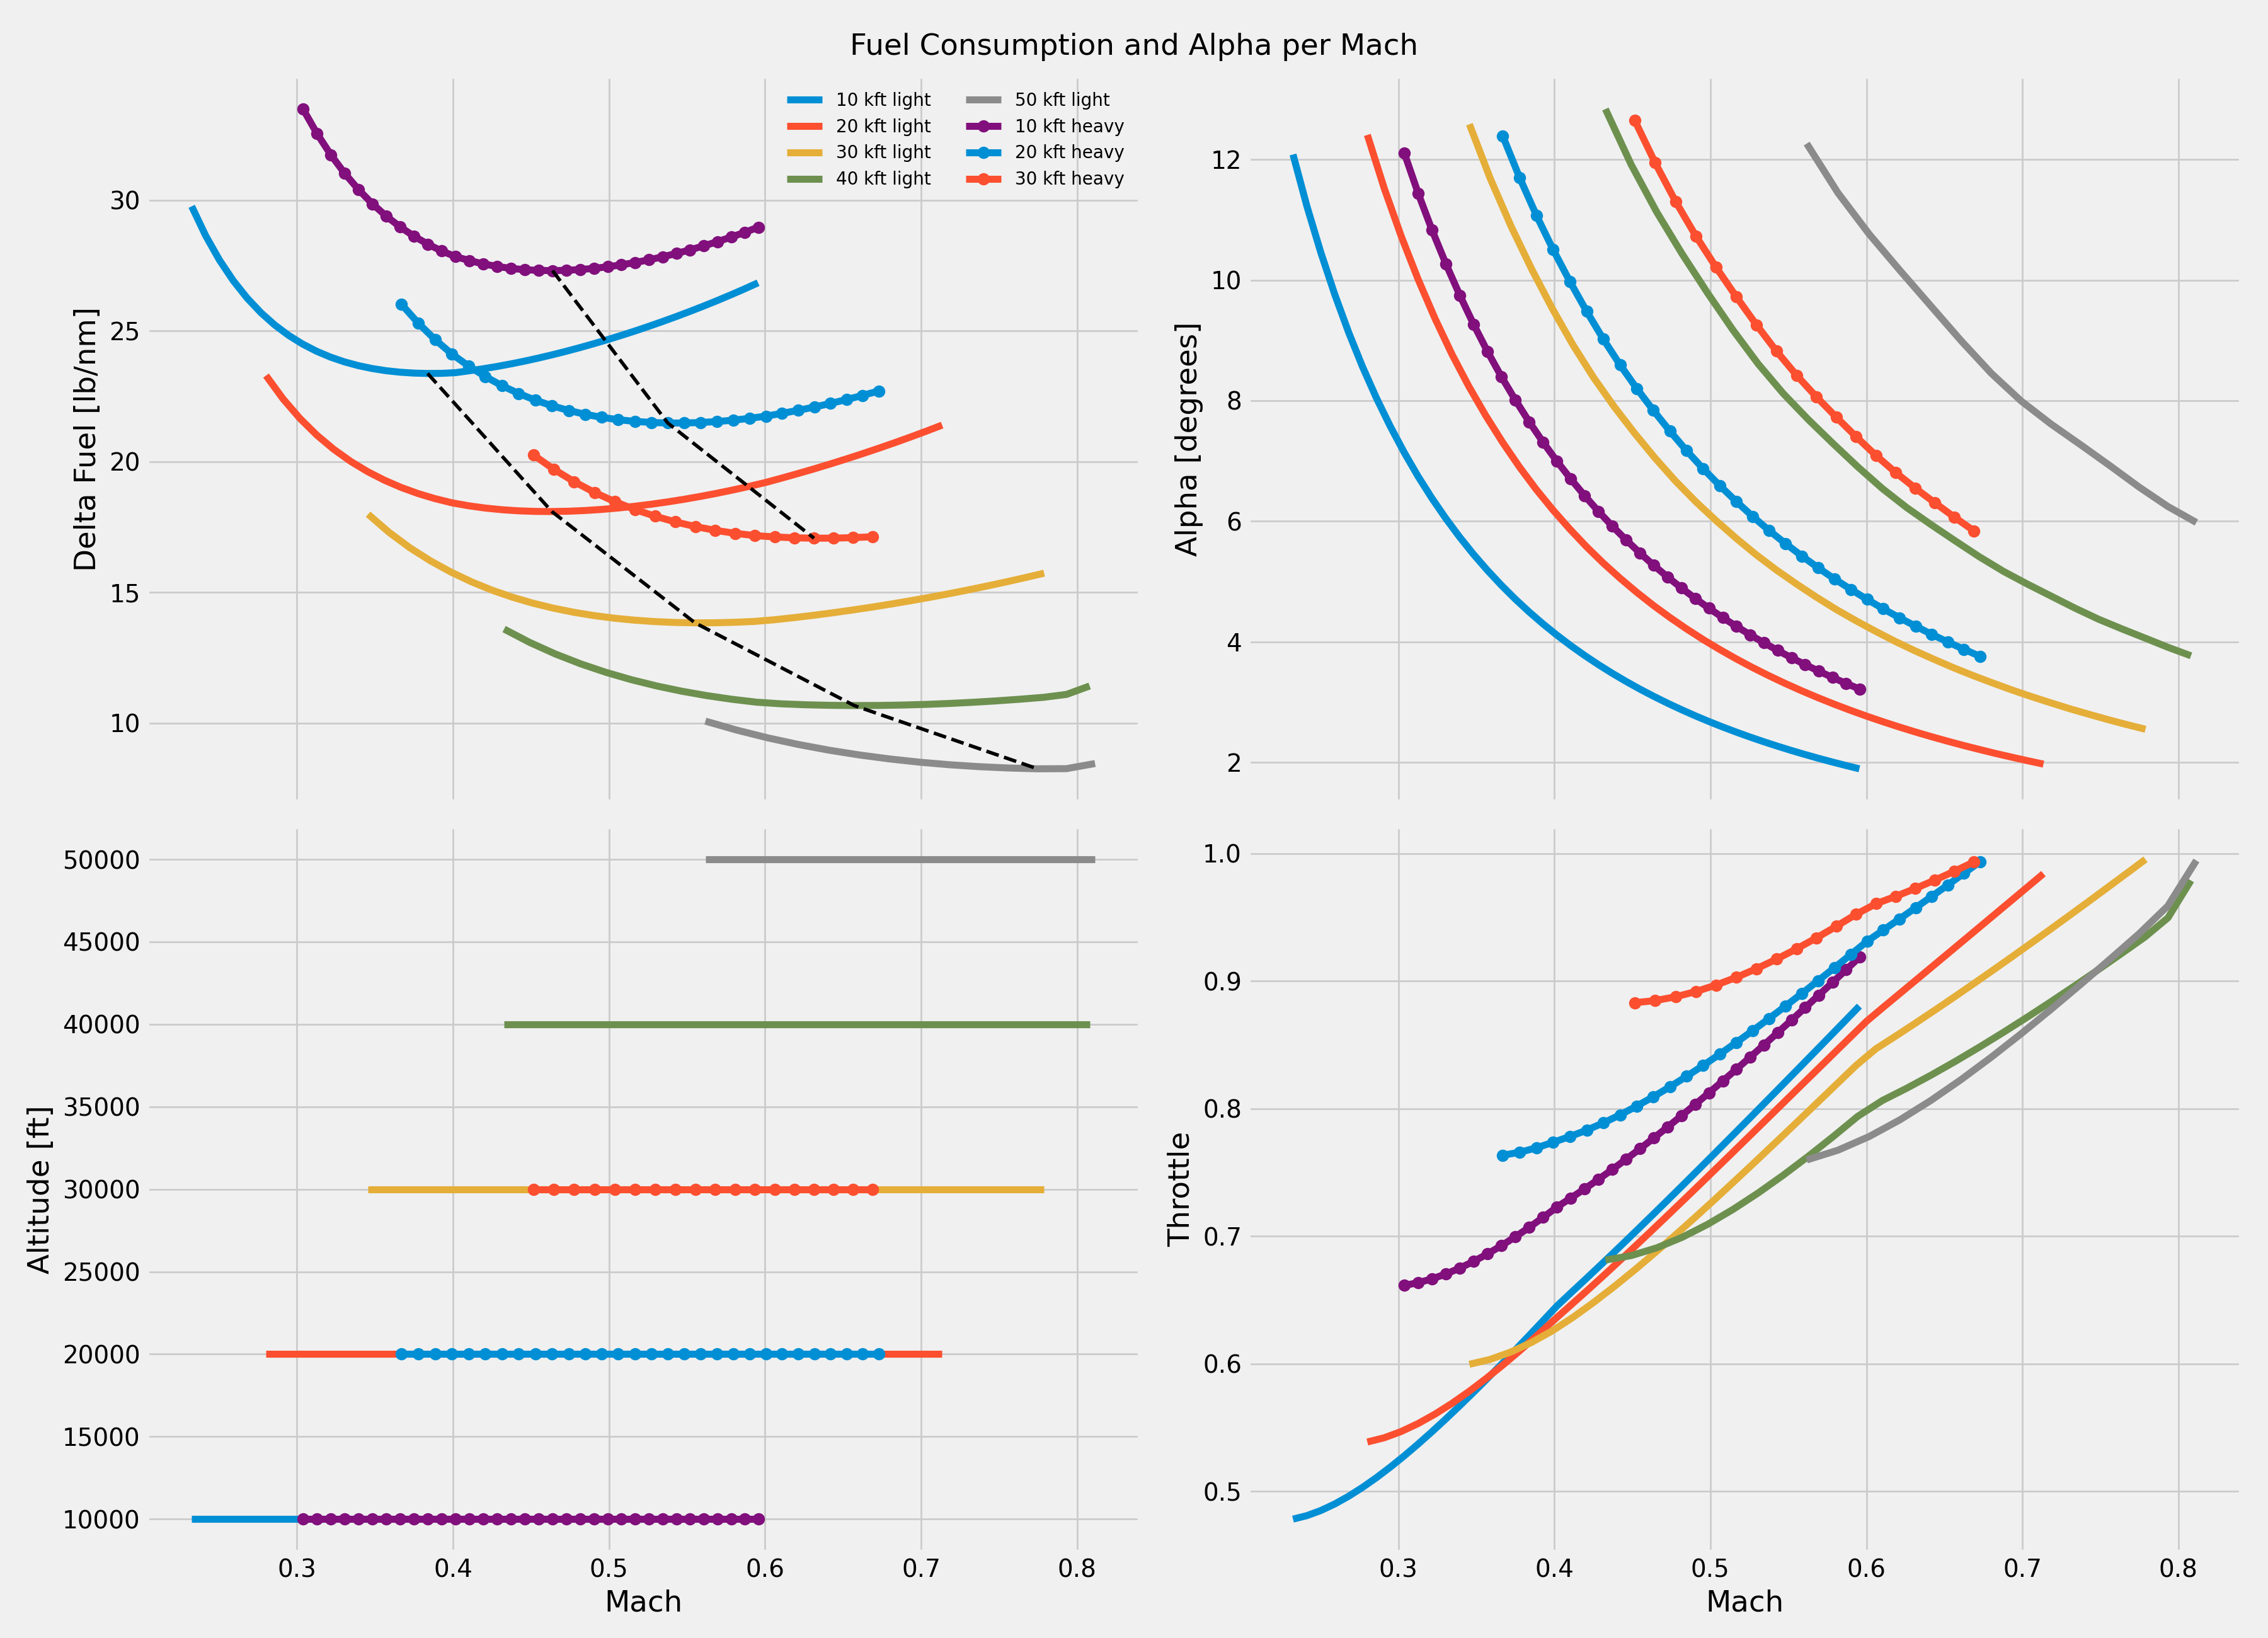
@gasilva how about plotting fuel consumption per nm on the y-axis with Mach on the x-axis to confirm there is a minimum for some particular Mach number. And then do that for different altitudes to see if you get an optimal Mach climb schedule similar to the graph I found earlier. |
Beta Was this translation helpful? Give feedback.
-
|
@seanmcleod see below. # Originally developed by JSBSim Team
# Modified by Guilherme A. L. da Silva - aerothermalsolutions.co
# Calculation required by aircraft icing enginering - fuel consumption
import jsbsim
import matplotlib.pyplot as plt
import matplotlib.style as style
style.use('fivethirtyeight')
#prepare subplots to overlay plots
fig, (ax,ax1) = plt.subplots(2,figsize=(9,12))
for k in range(8):
results=[]
i=0
tank=[]
for j in range(24):
fdm = jsbsim.FGFDMExec('../../')
fdm.load_model('global5000')
# Set engines running
fdm['propulsion/engine[0]/set-running'] = 1
fdm['propulsion/engine[1]/set-running'] = 1
fdm['ic/h-sl-ft'] = 5000+k*5000
fdm['ic/gamma-deg'] = 0
fdm['ap/alpha_hold']= 0
fdm['ap/altitude_hold']= 0
fdm['ic/vc-kts']=90+6*float(j)
tank0i=fdm["propulsion/tank[0]/contents-lbs"]
tank1i=fdm["propulsion/tank[1]/contents-lbs"]
tank2i=fdm["propulsion/tank[2]/contents-lbs"]
fdm.run_ic() # Initialize the aircraft with initial conditions
fdm.run()
# Trim
try:
fdm['simulation/do_simple_trim'] = 1
while fdm.run() and fdm.get_sim_time() <= 100:
if fdm.get_sim_time()<1:
fdm['ap/altitude_hold']= 1
fdm.run()
results.append((fdm['simulation/sim-time-sec'],fdm['velocities/vc-kts'], fdm['aero/alpha-deg'],fdm["propulsion/tank[0]/contents-lbs"],fdm["propulsion/tank[1]/contents-lbs"],fdm["propulsion/tank[2]/contents-lbs"]))
tank0f=fdm["propulsion/tank[0]/contents-lbs"]
tank1f=fdm["propulsion/tank[1]/contents-lbs"]
tank2f=fdm["propulsion/tank[2]/contents-lbs"]
deltaTank0=tank0i-tank0f
deltaTank1=tank1i-tank1f
deltaTank2=tank2i-tank2f
deltaTotal=deltaTank0+deltaTank2+deltaTank1
print("--------------------------------------")
print("Fuel Consumed = {}".format(deltaTotal))
print("Average Rate Fuel Consumed per hour = {}".format(deltaTotal/(1600/3600)))
print("--------------------------------------")
tank.append((fdm['velocities/mach'],fdm['aero/alpha-deg'],fdm['ic/h-sl-ft'],deltaTotal))
except RuntimeError as e:
if e.args[0] != 'Trim Failed':
raise
time, speed, alpha, tank0, tank1, tank2 = zip(*results)
machPlot,alpha,altitude,deltaPlot = zip(*tank)
ax.plot(machPlot, deltaPlot,'-',label="{:.0f} kft".format(altitude[1]/1000))
ax1.plot(machPlot, alpha,'-')
ax.legend(frameon=False)
ax1.set_xlabel('Mach')
ax.set_ylabel('Delta Fuel [lb]')
ax1.set_ylabel('Alpha [degrees]')
fig.suptitle('Fuel Consumption and Alpha per Mach')
plt.tight_layout()
plt.show()
|
Beta Was this translation helpful? Give feedback.
-
|
|
Beta Was this translation helpful? Give feedback.
-
PropertyManager->Tie("position/distance-from-start-mag-mt", this, &FGAuxiliary::GetDistanceRelativePosition); |
Beta Was this translation helpful? Give feedback.
-
|
I can do it for weight instead of altitude |
Beta Was this translation helpful? Give feedback.
-
|
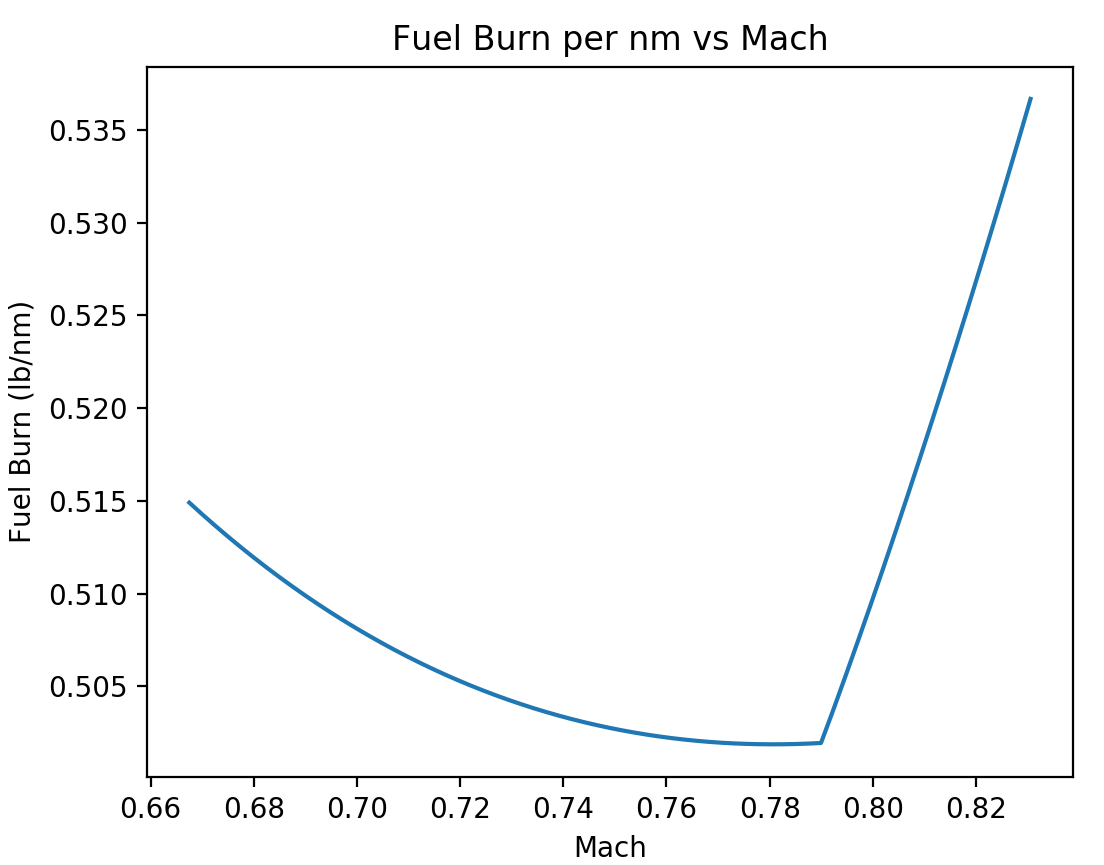
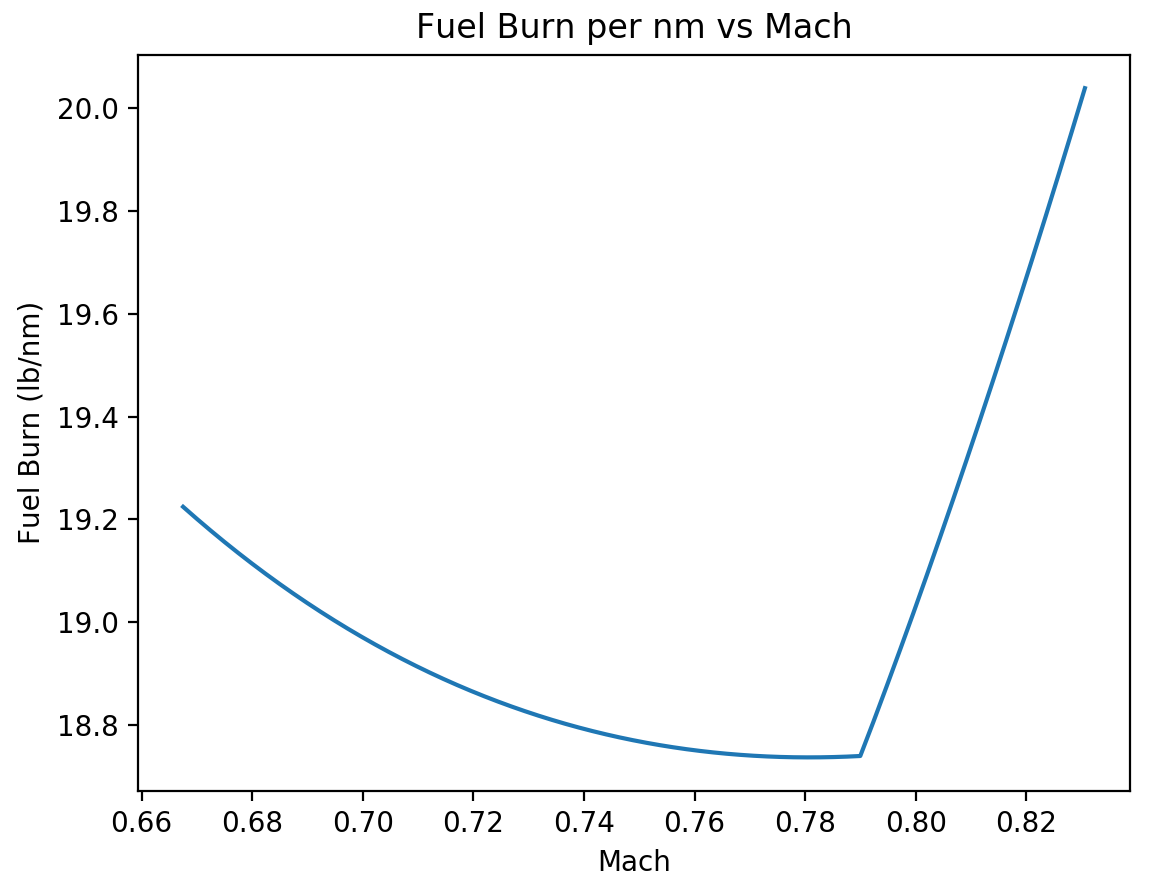
I'm still suspicious of the high throttle values for the 737, but here is the resulting fuel burn per nm. With a clear minimum round Mach 0.79. This is for the default weight and at 30,000ft. mach = fdm['velocities/mach']
fuelflow = fdm['propulsion/engine[0]/fuel-flow-rate-pps'] * 2
time = 589.1641 / 3600 # time in s to cover 1nm at Mach 1 at 30,000ft
fuelburn = (time / mach) * fuelflow
|
Beta Was this translation helpful? Give feedback.
-
|
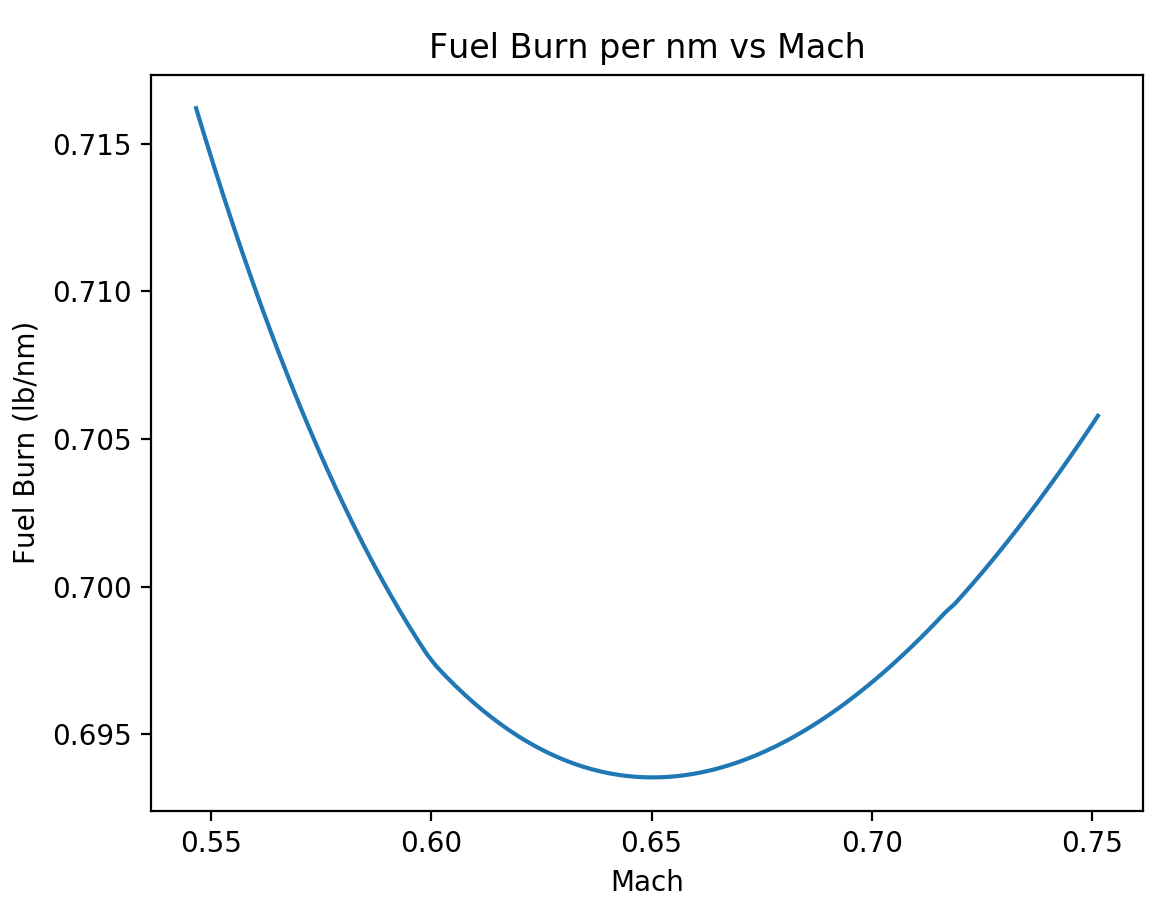
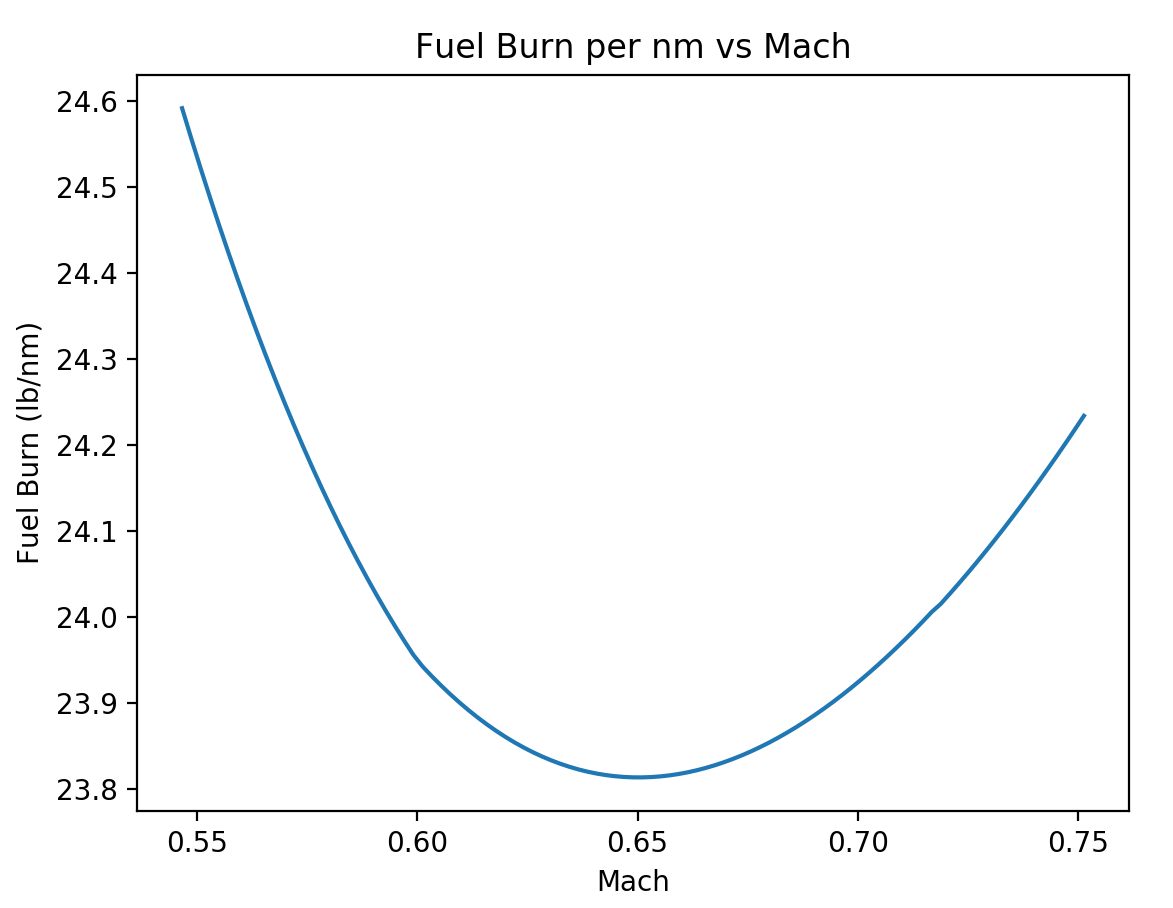
And for the 737 at 20,000ft.
|
Beta Was this translation helpful? Give feedback.
-
|
Your results are one order higher and the minimum is located at high speed
like a Carson Cruise.
See my new results after a correction.
Now it is similar than yours bur the consumption is still high.
what is the conversion factor that you are using to nm?
|
Beta Was this translation helpful? Give feedback.
-
|
Yep, messed up the conversion from lb/s fuel flow to lb/nm. Corrected graphs, same shape and minimum, but different values for lb/nm. At 30,000ft.
At 20,000ft
|
Beta Was this translation helpful? Give feedback.
-
|
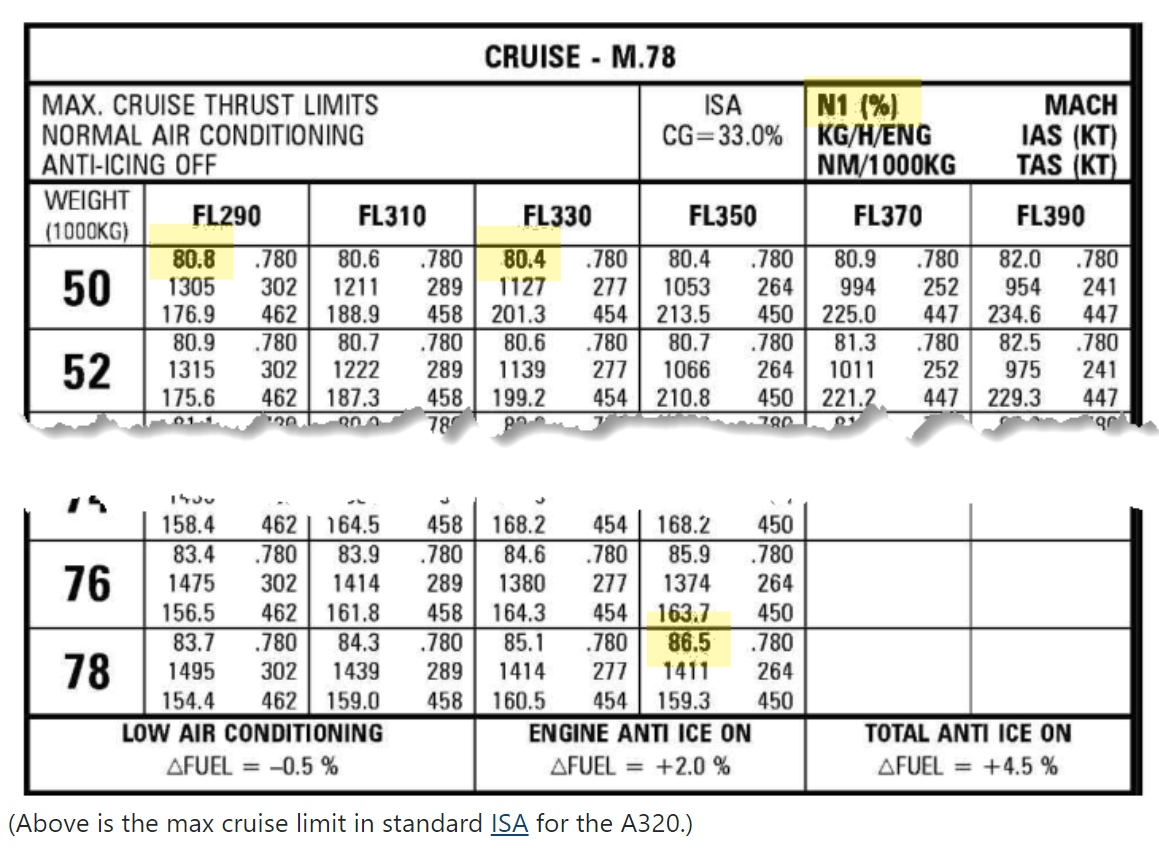
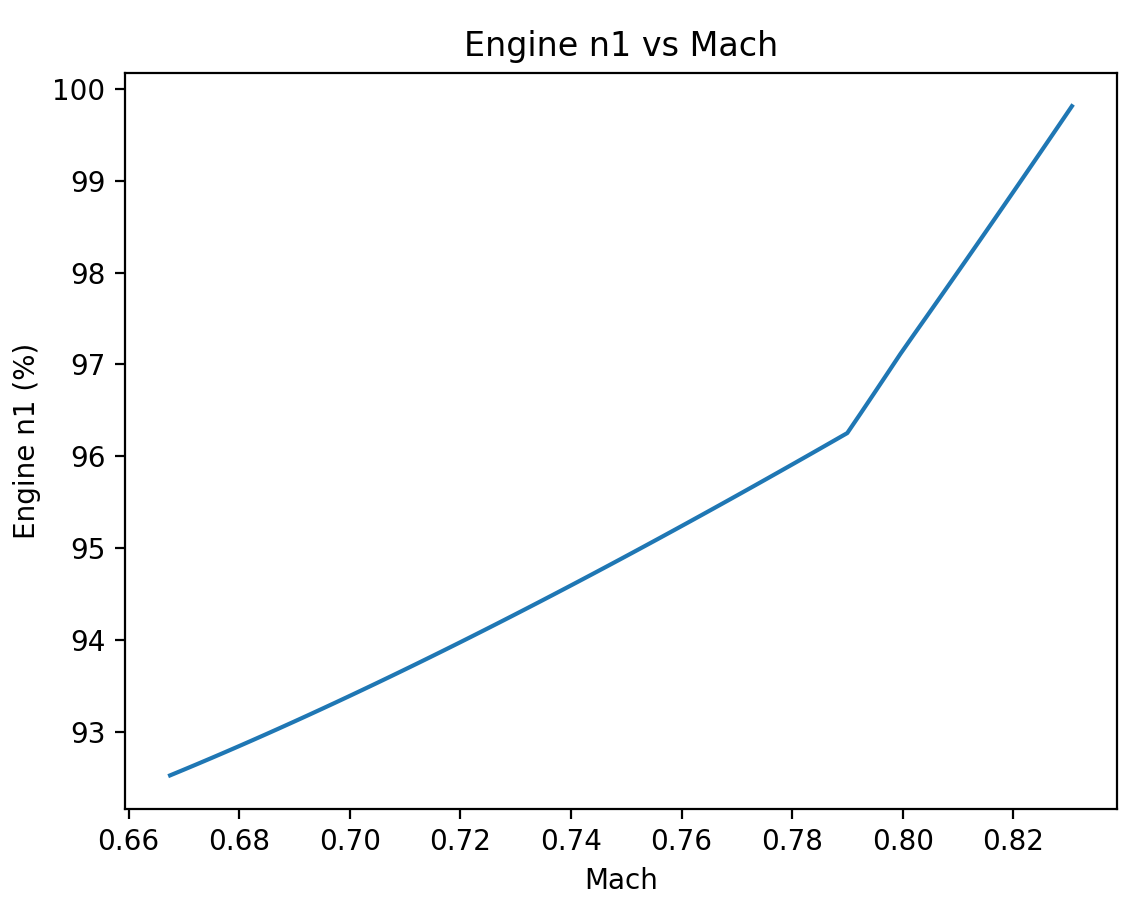
So, came across this snippet for the A320 in terms of engine performance, max cruise thrust limits.
And plotting n1 % for the JSBSim 737 model I get for 30,000ft.
Guess there could be an issue with the engine model being used by the 737, or maybe the 737 model has excessive drag? |
Beta Was this translation helpful? Give feedback.
-
|
Yes can be the drag....I had to correct the drag polar produced by Aeromatic |
Beta Was this translation helpful? Give feedback.
-
|
for 10 seconds of flight Normalized by distance flied |
Beta Was this translation helpful? Give feedback.
-
|
Can you post your before and after changes to the drag entries? |
Beta Was this translation helpful? Give feedback.
-
|
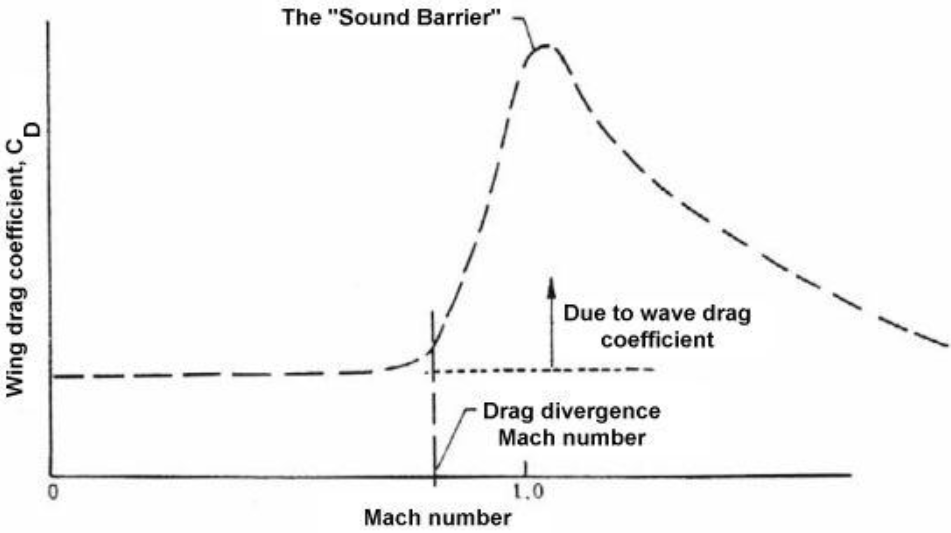
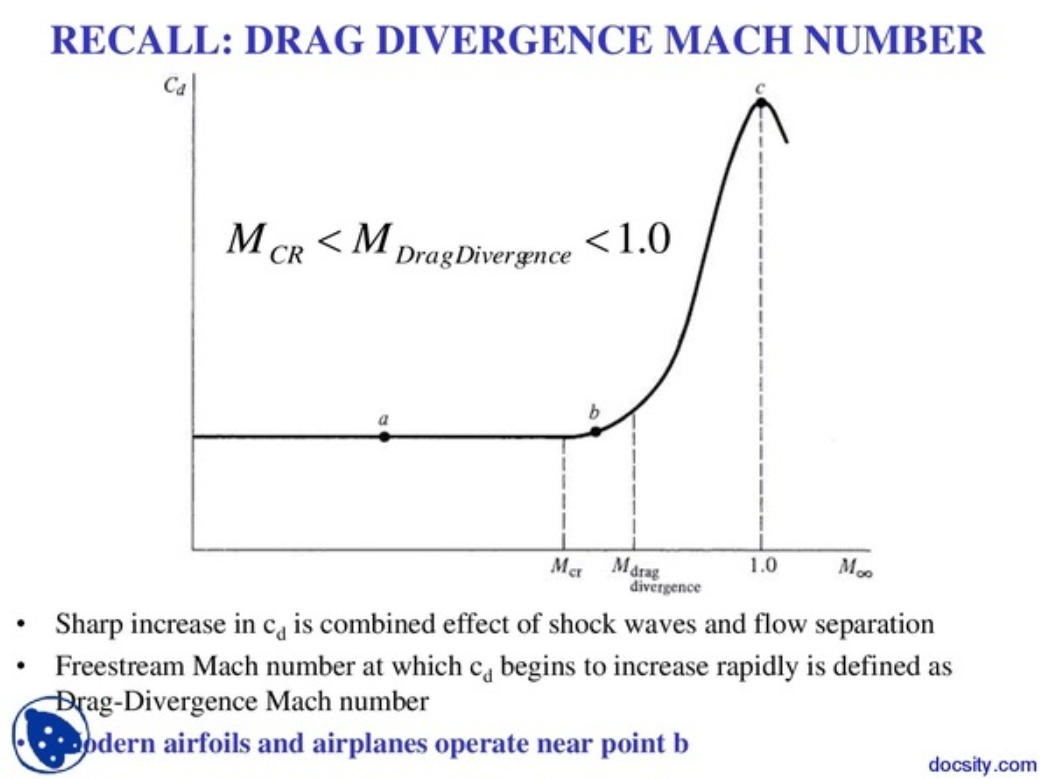
In terms of the kink at Mach 0.79 for most of the 737 graphs, it looks like it's triggered by the increase in drag due to mach that only starts kicking in from Mach 0.79. Bit suspicious that the value for 0.79 is 0. <function name="aero/coefficient/CDmach">
<description>Drag_due_to_mach</description>
<product>
<property>aero/qbar-psf</property>
<property>metrics/Sw-sqft</property>
<table>
<independentVar>velocities/mach</independentVar>
<tableData>
0.00 0.0000
0.79 0.0000
1.10 0.0230
1.80 0.0150
</tableData>
</table>
</product>
</function> |
Beta Was this translation helpful? Give feedback.
-
|
Given the higher Mach values in the table (1.1, 1.8) I'd say it has been copy-pasted from another aircraft model ?🤨 As for the additional drag being triggered at Mach 0.79, I'm guessing that it is supposed to account for transonic drag i.e. shock waves starting to form above 0.79 ? |
Beta Was this translation helpful? Give feedback.
-
Yep, I guess I was expecting it to be more of a gradual increase from a lower Mach number, as opposed to 0 and then a sudden kink at 0.79. However looking up some examples the shape doesn't seem to be that far off.
|
Beta Was this translation helpful? Give feedback.
-
|
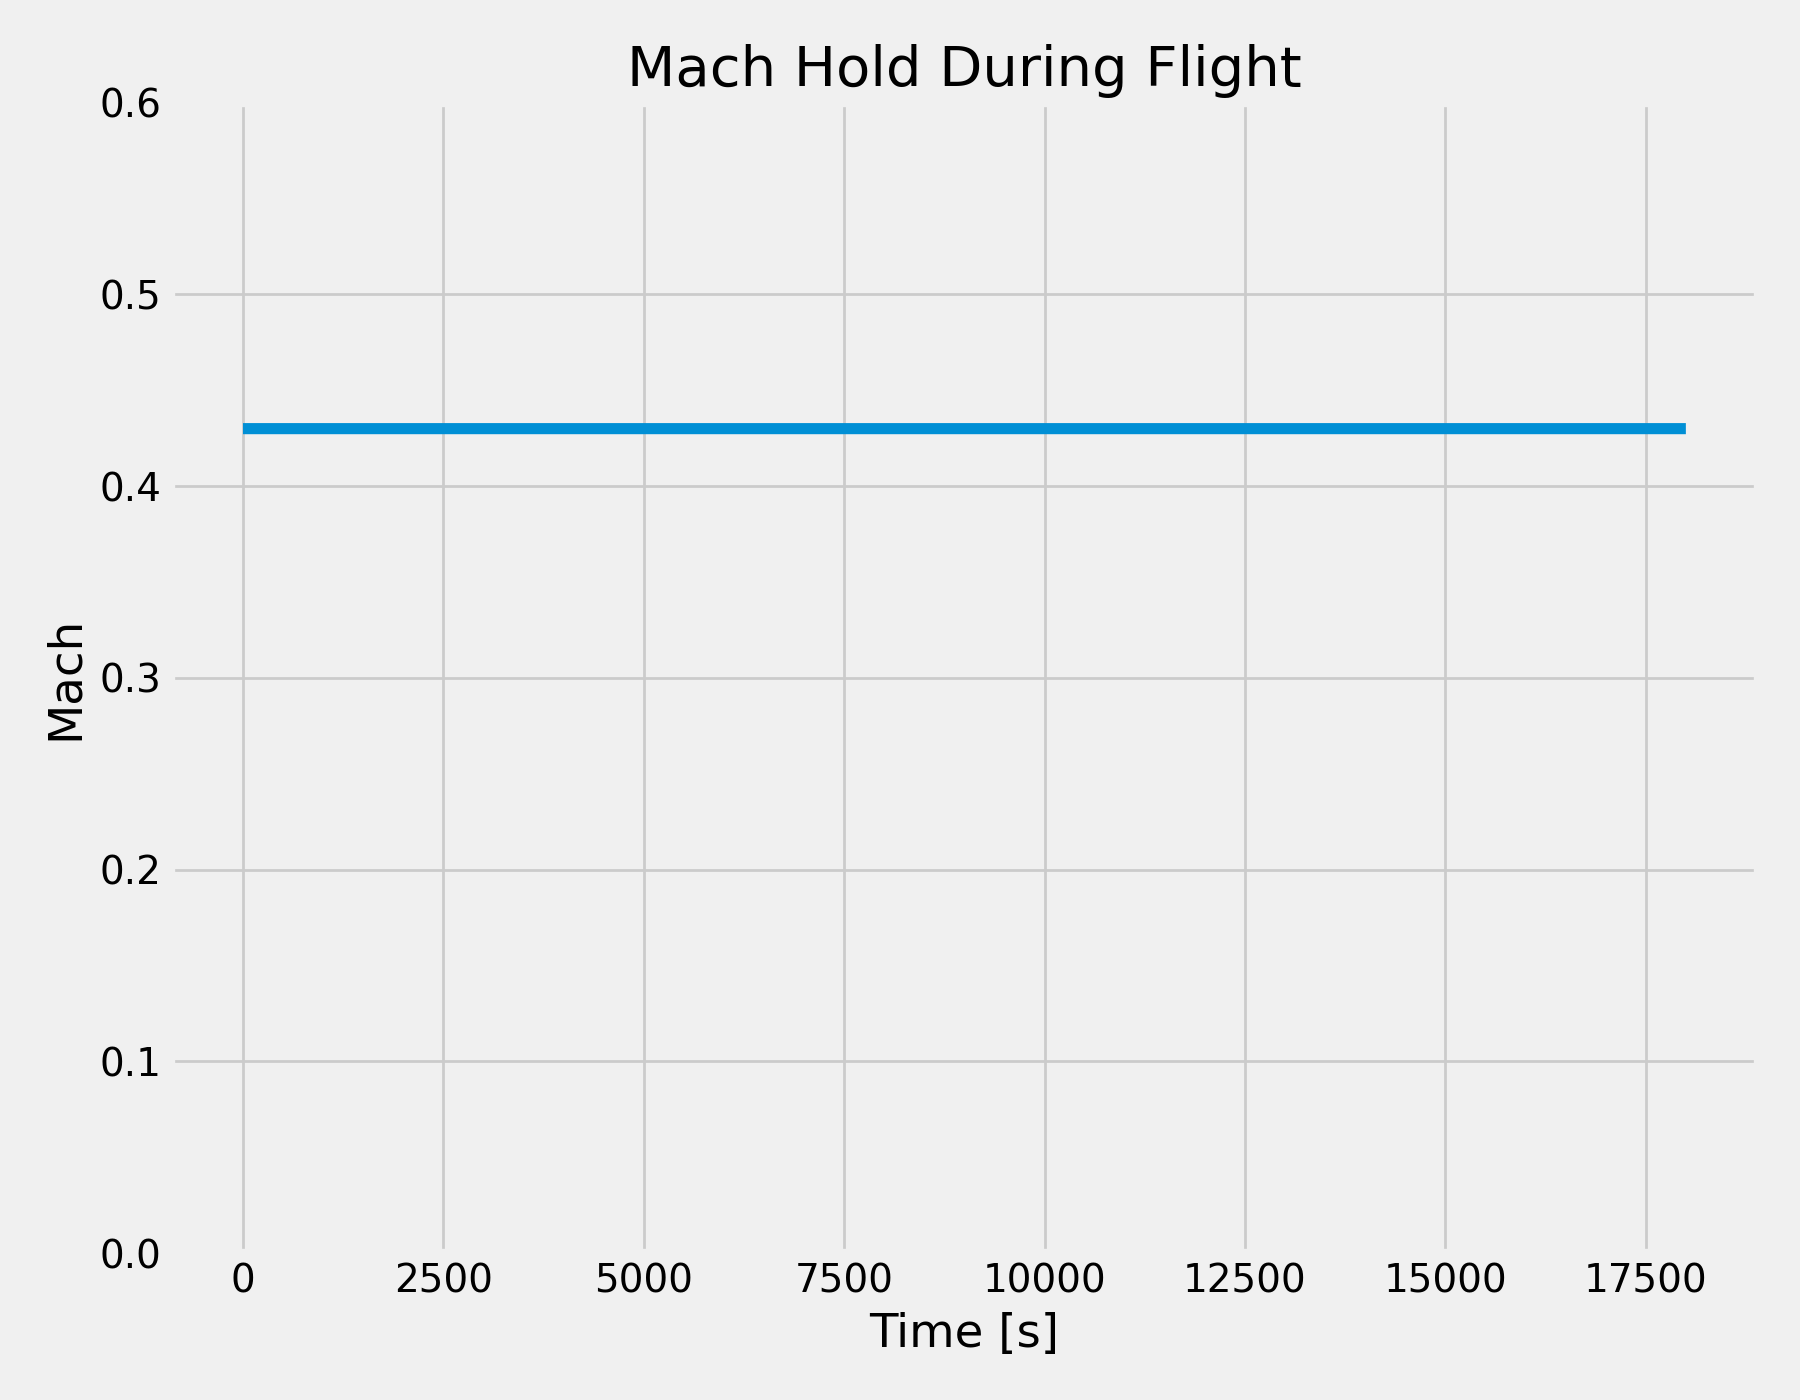
I am trying to implement a autopilot to keep mach number during a long flight. However, it is not working. To keep alpha is OK. @seanmcleod told me that the correct to save fuel is to keep mach instead of alpha. |
Beta Was this translation helpful? Give feedback.
-
|
the problem is the error is not being calculated..is equal to ZERO |
Beta Was this translation helpful? Give feedback.
-
|
You've got a logic error in your clipto for calculating the mach error, it needs to go from -0.5 5o +0.5. |
Beta Was this translation helpful? Give feedback.
-
|
Yes. I fixed that. My mistake...the error must go negative... but it still not working... |
Beta Was this translation helpful? Give feedback.
-
|
Log |
Beta Was this translation helpful? Give feedback.
-
|
Beta Was this translation helpful? Give feedback.
-
|
So the set point is smaller than the current Mach but pos-norm has been increased relative to cmd-norm, another sign issue? |
Beta Was this translation helpful? Give feedback.
-
|
I inverted the sign of engine command to sum not subtract and nothing happened...it appears that throttle is returning to .98 always... |
Beta Was this translation helpful? Give feedback.
-
|
Beta Was this translation helpful? Give feedback.
-
|
I changed the script and the airborne.xml to mach=0.45....it is stable but the problem returning the value of
|
Beta Was this translation helpful? Give feedback.
-
|
But why do you think\expect <summer name="fcs/throttle-cmd-norm[0]">
<input> fcs/throttle-cmd-norm[0] </input>
<input> -ap/throttle-cmd </input>
<clipto>
<min> 0.5 </min>
<max> 1.0 </max>
</clipto>
</summer> |
Beta Was this translation helpful? Give feedback.
-
|
making that change generate an error of Trim failure. But the system is working now! Thank you very much for your debug and tips. |
Beta Was this translation helpful? Give feedback.
-
|
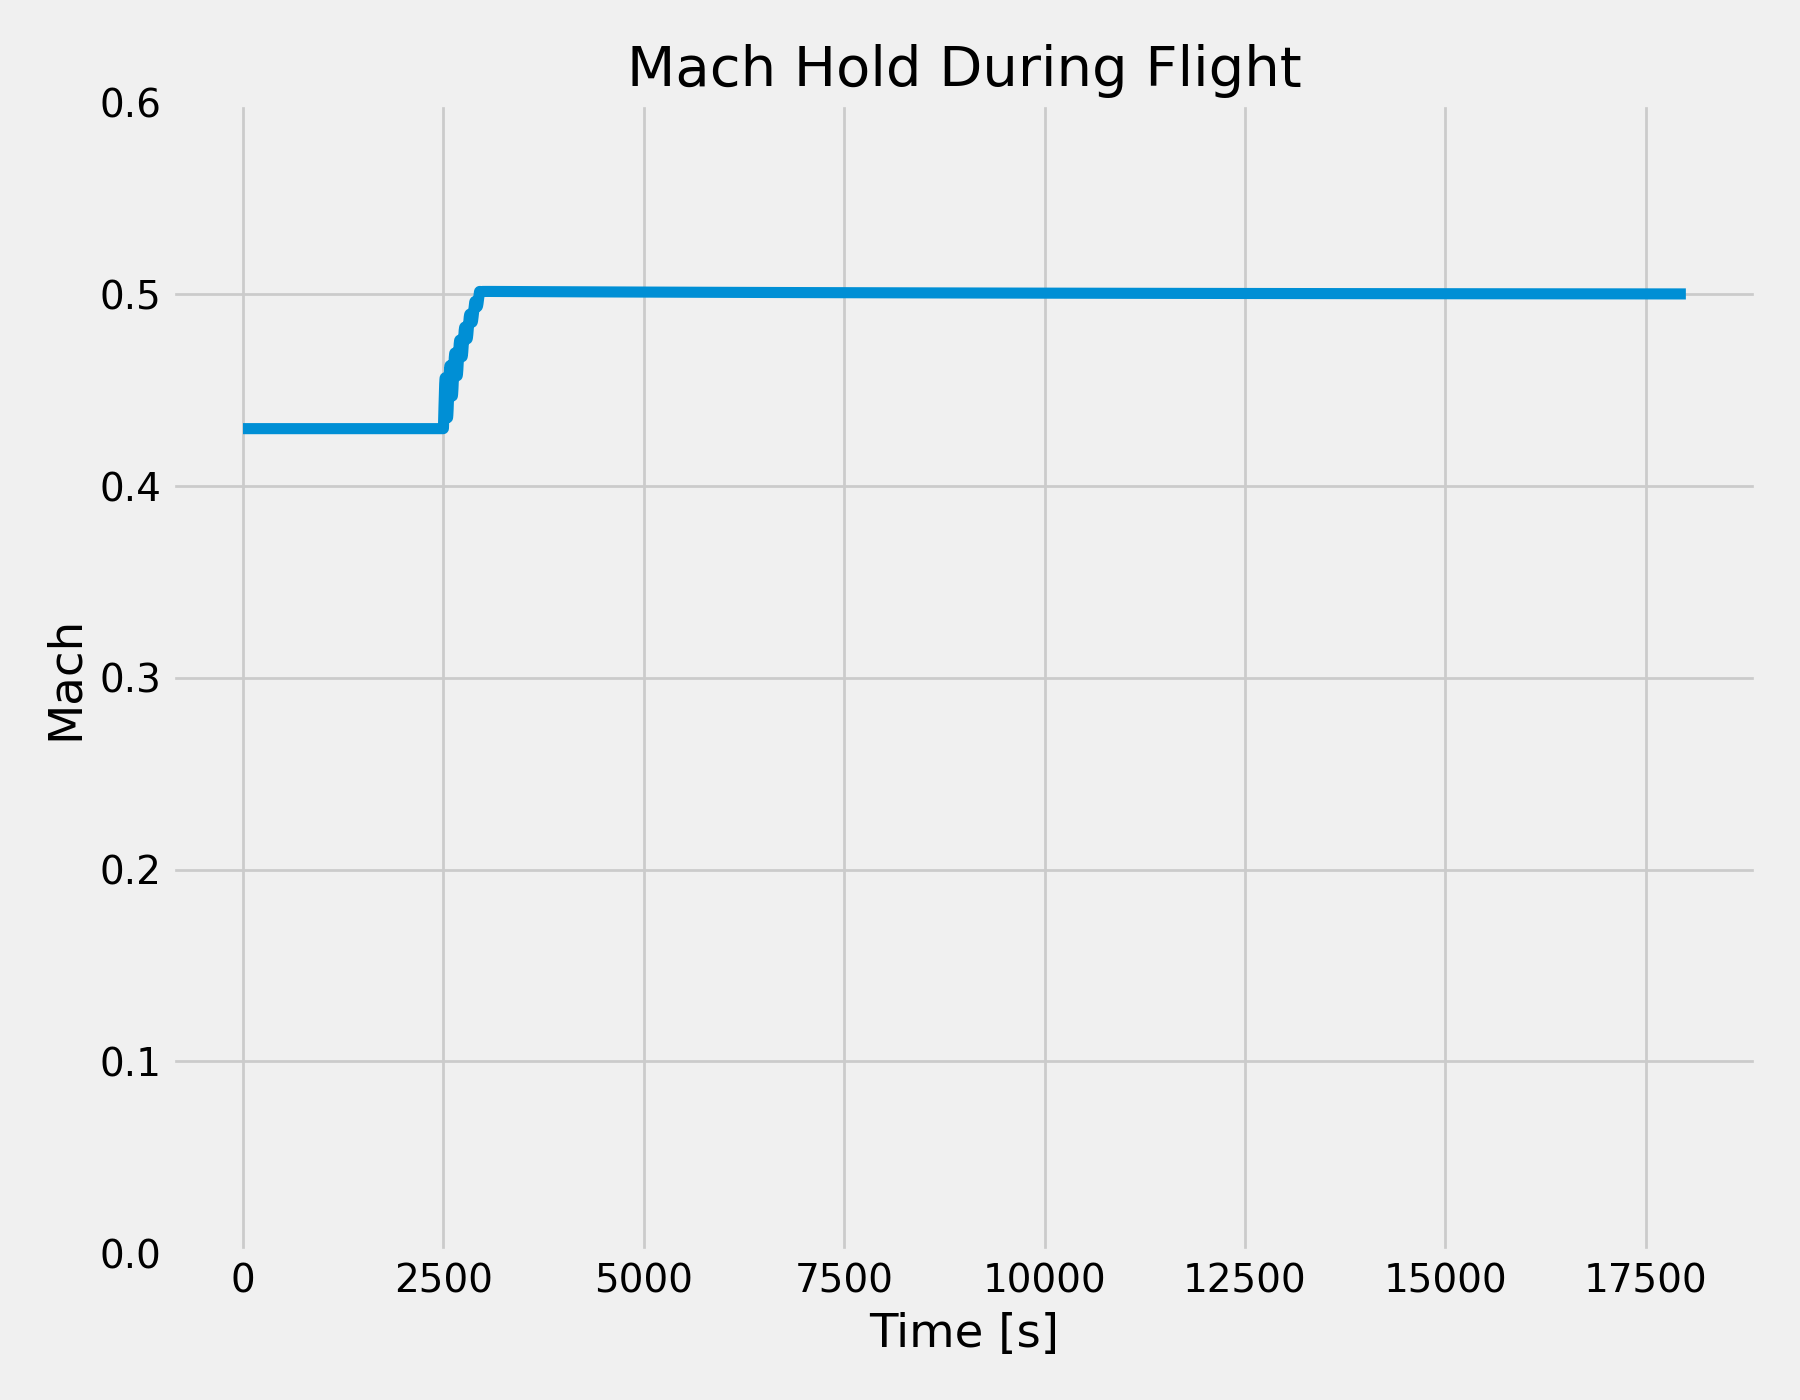
What does the response look like after you apply a step input to the Mach setpoint, e.g. if you increase the Mach setpoint to say Mach 0.5 at time 2500s? |
Beta Was this translation helpful? Give feedback.
-
|
There is a high frequency in the ramp. I do not know if it is a problem or not. |
Beta Was this translation helpful? Give feedback.
-
|
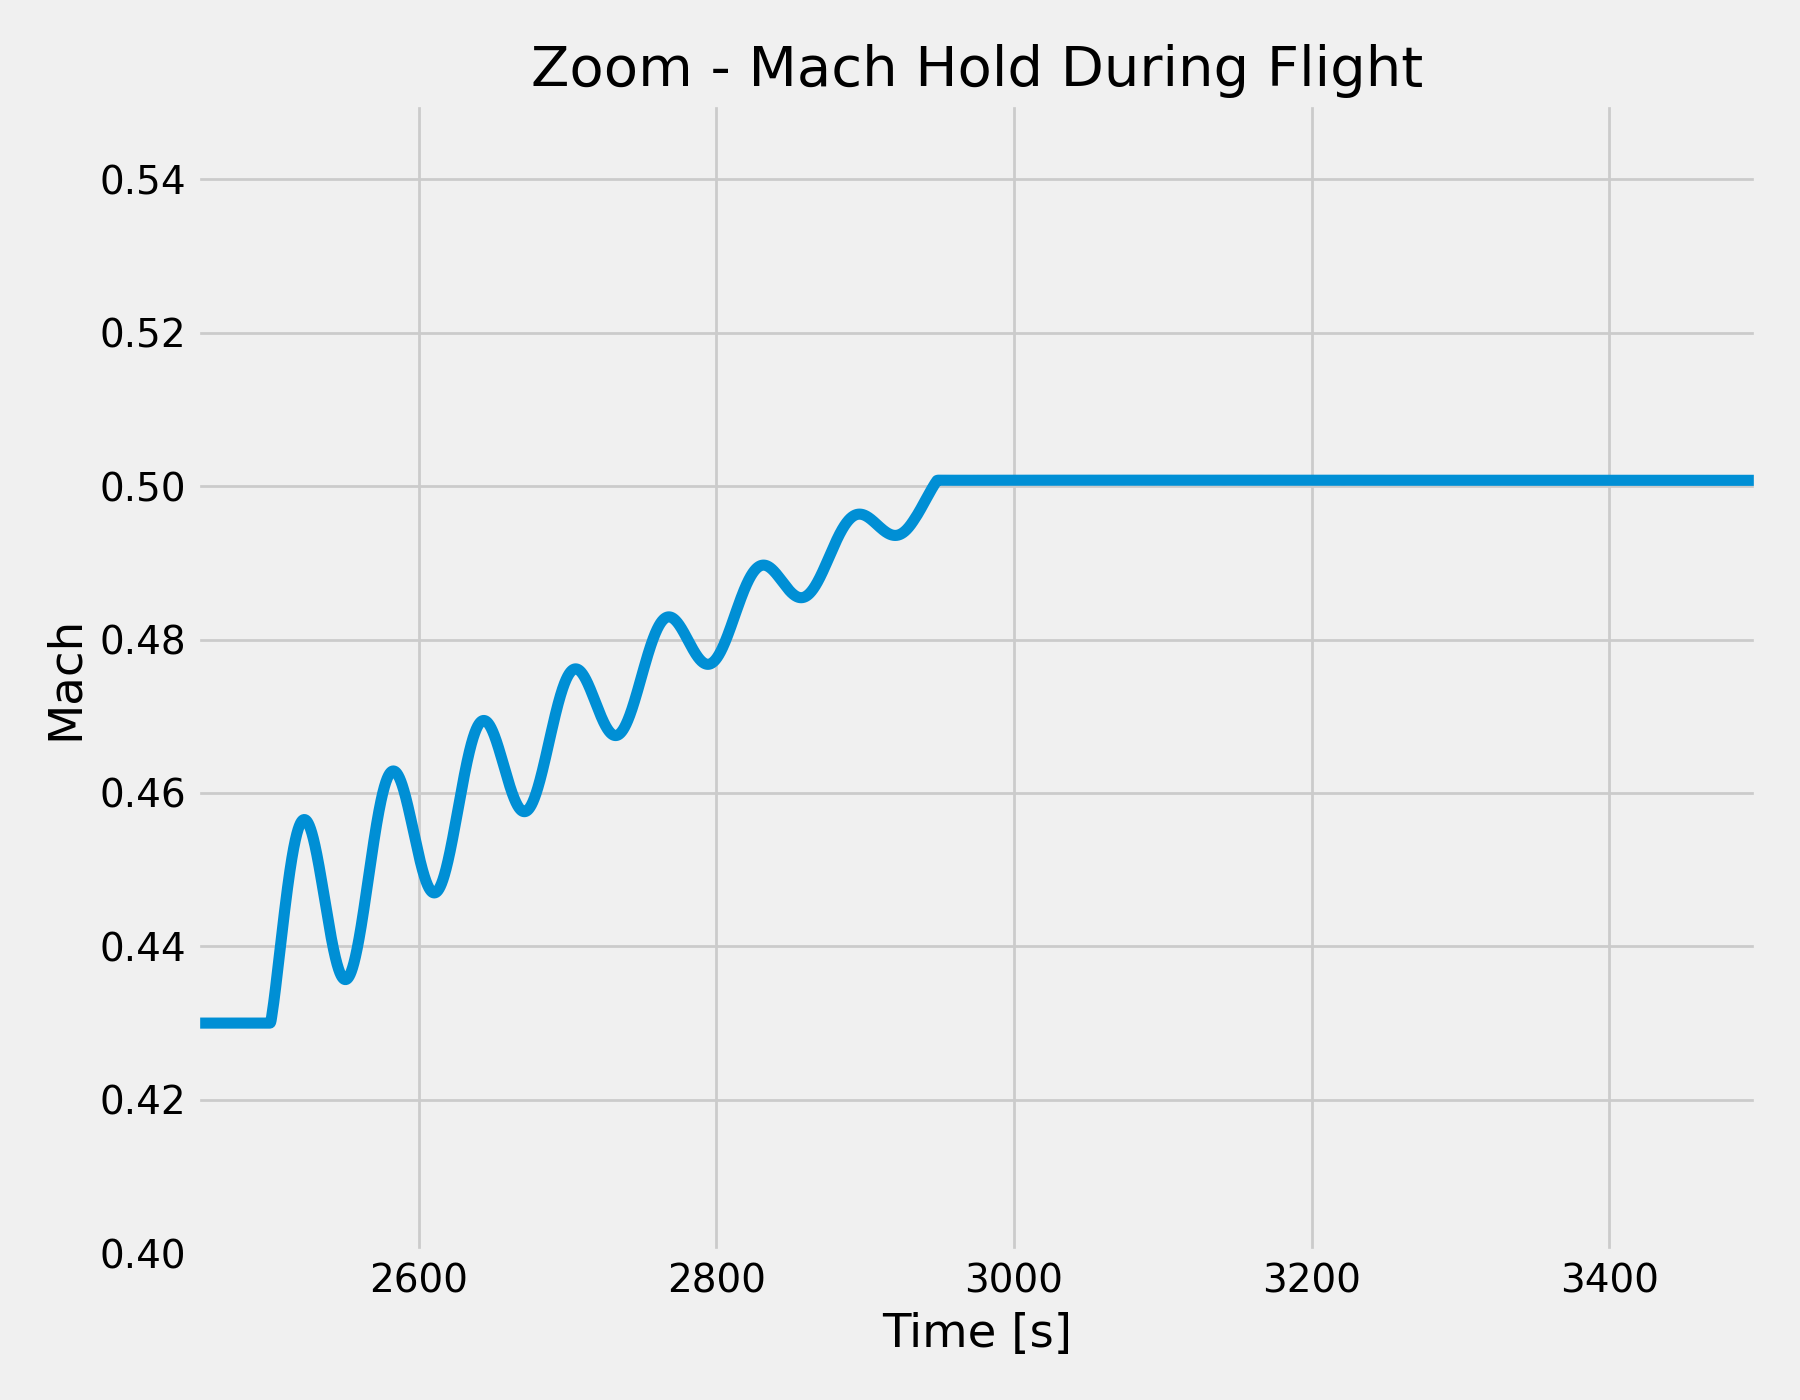
Does imply that the PID gains ideally need to be tuned. Can you zoom in by graphing say just 5s before the step input until say 5s after it stabilizes at Mach 0.5 to getter idea of the oscillations in-between? |
Beta Was this translation helpful? Give feedback.
-
|
|
Beta Was this translation helpful? Give feedback.
-
|
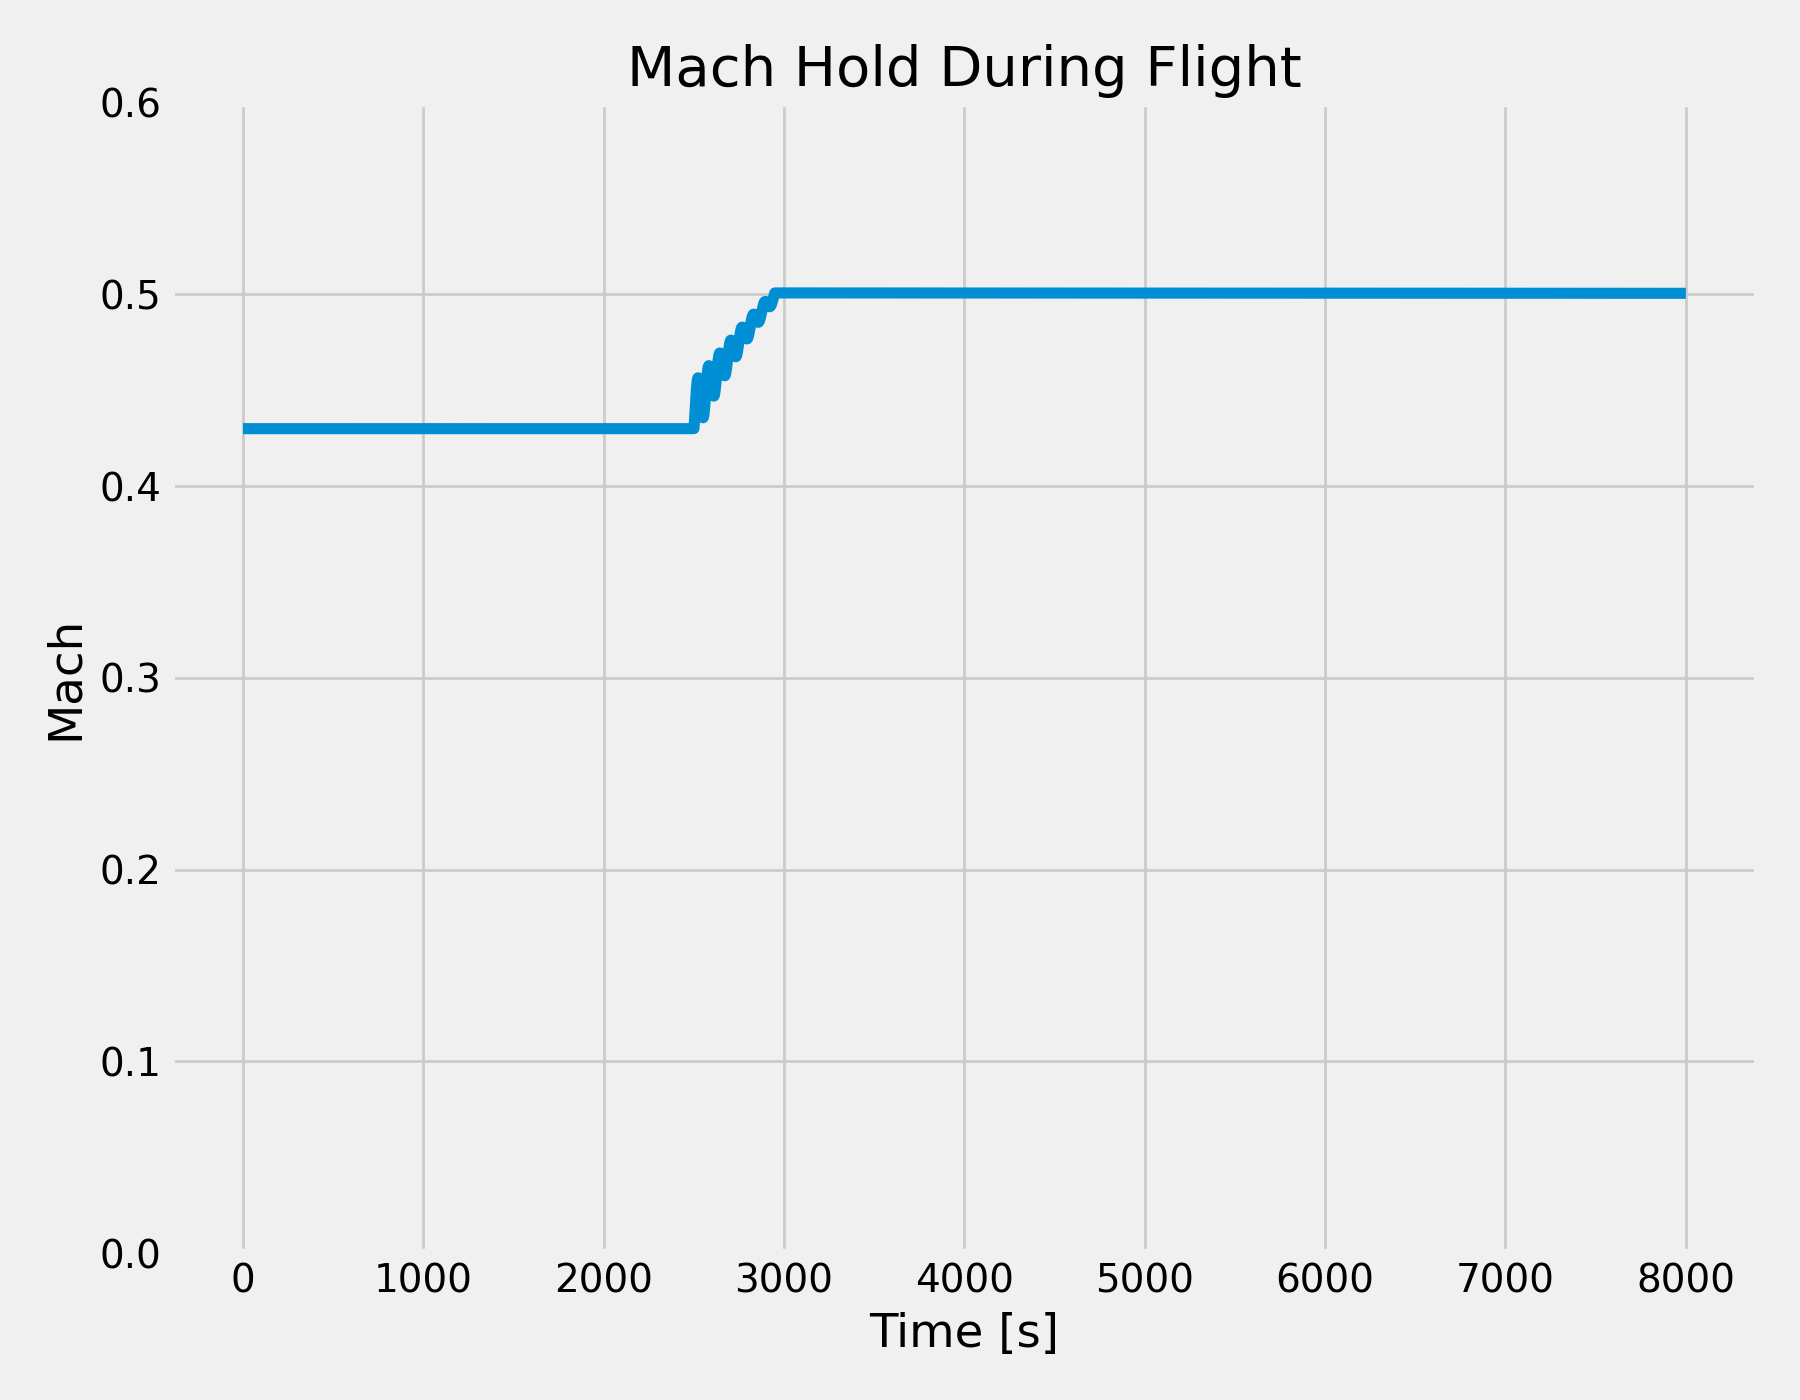
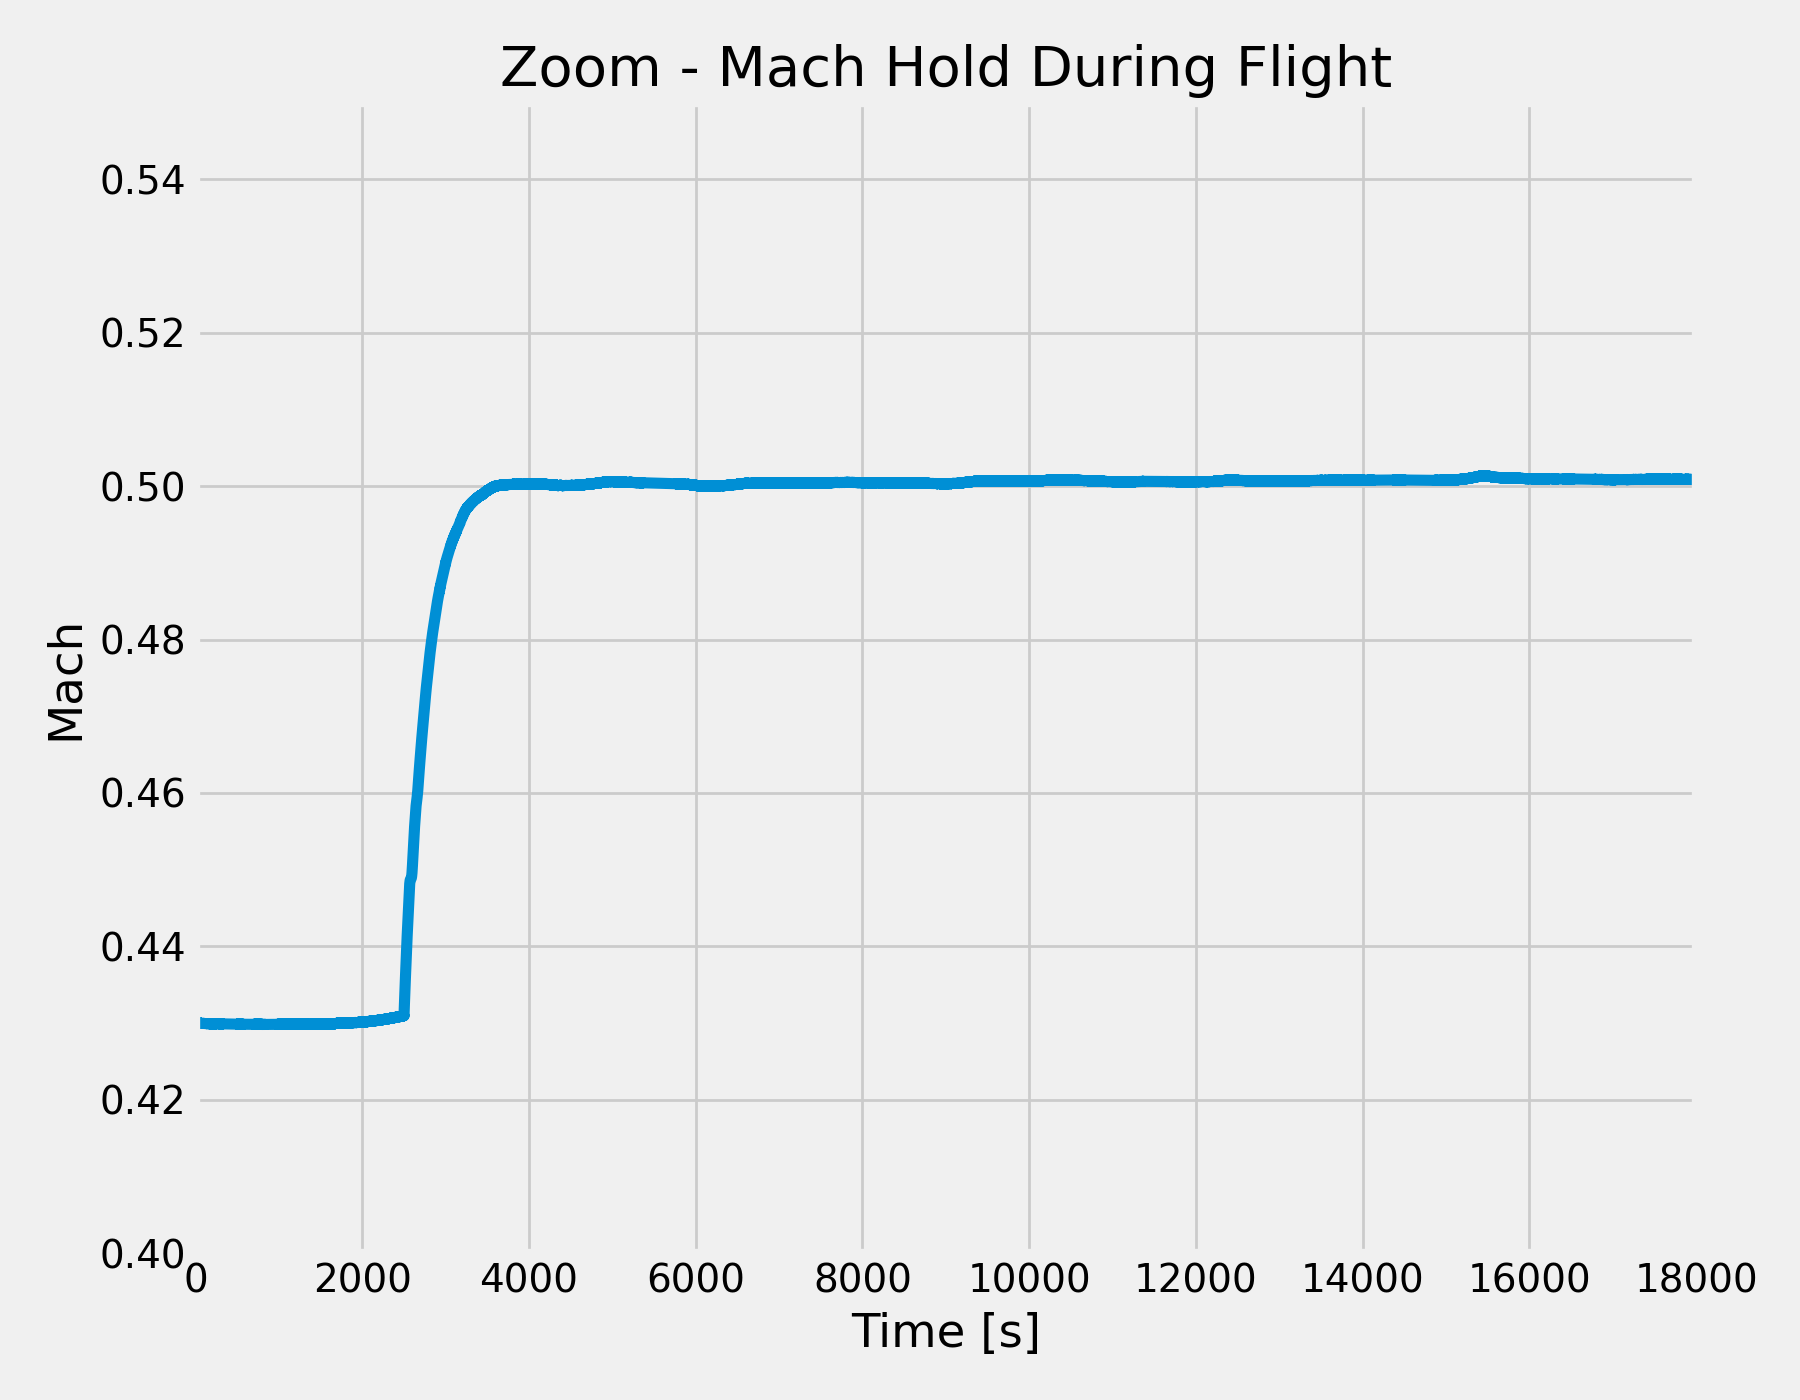
I implemented a lag filter and tried to adjust quickly the PID. <channel name="Mach hold">
<!-- Compute the error between the target mach and the actual value -->
<summer name="aero/mach-error">
<input> ap/mach_setpoint </input>
<input> -velocities/mach</input>
<clipto>
<min> -.25 </min>
<max> .25 </max>
</clipto>
</summer>
<pid name="aero/mach-hold-pid">
<input> aero/mach-error </input>
<kp> 3500 </kp>
<ki> .25 </ki>
<kd> 800000 </kd>
<clipto>
<min> -1 </min>
<max> 1 </max>
</clipto>
</pid>
<!-- Forces the auto throttle value to 0 when ap/alpha_hold is different than 1.0
This allows to disable the autothrottle. -->
<switch name="ap/throttle-cmd">
<default value="0.0"/>
<test value="aero/mach-hold-pid">
ap/mach_hold == 1
</test>
</switch>
<lag_filter name="ap/throttle-cmd-filter">
<input> ap/throttle-cmd </input>
<c1> 0.7 </c1>
<clipto>
<min> -1 </min>
<max> 1 </max>
</clipto>
</lag_filter>
<!-- Drives engine #0 throttle position -->
<summer name="fcs/throttle-pos-norm[0]">
<input> fcs/throttle-cmd-norm[0] </input>
<input> ap/throttle-cmd-filter </input>
<clipto>
<min> 0.0 </min>
<max> 1.0 </max>
</clipto>
</summer>
<!-- Drives engine #1 throttle position -->
<summer name="fcs/throttle-pos-norm[1]">
<input> fcs/throttle-cmd-norm[1] </input>
<input> ap/throttle-cmd-filter </input>
<clipto>
<min> 0.0 </min>
<max> 1.0 </max>
</clipto>
</summer>
</channel>
|
Beta Was this translation helpful? Give feedback.
Uh oh!
There was an error while loading. Please reload this page.
-
How can I generate a curve KCAS versus angle of attack by considering weight and CG position?
Does JSBSim solve it?
The curve for one weight and one CG should be:
https://www.boeing.com/commercial/aeromagazine/aero_12/images/attack_aoaanderrors.jpg
Beta Was this translation helpful? Give feedback.
All reactions