Nesting Plot for Grouping Variables #24
Description
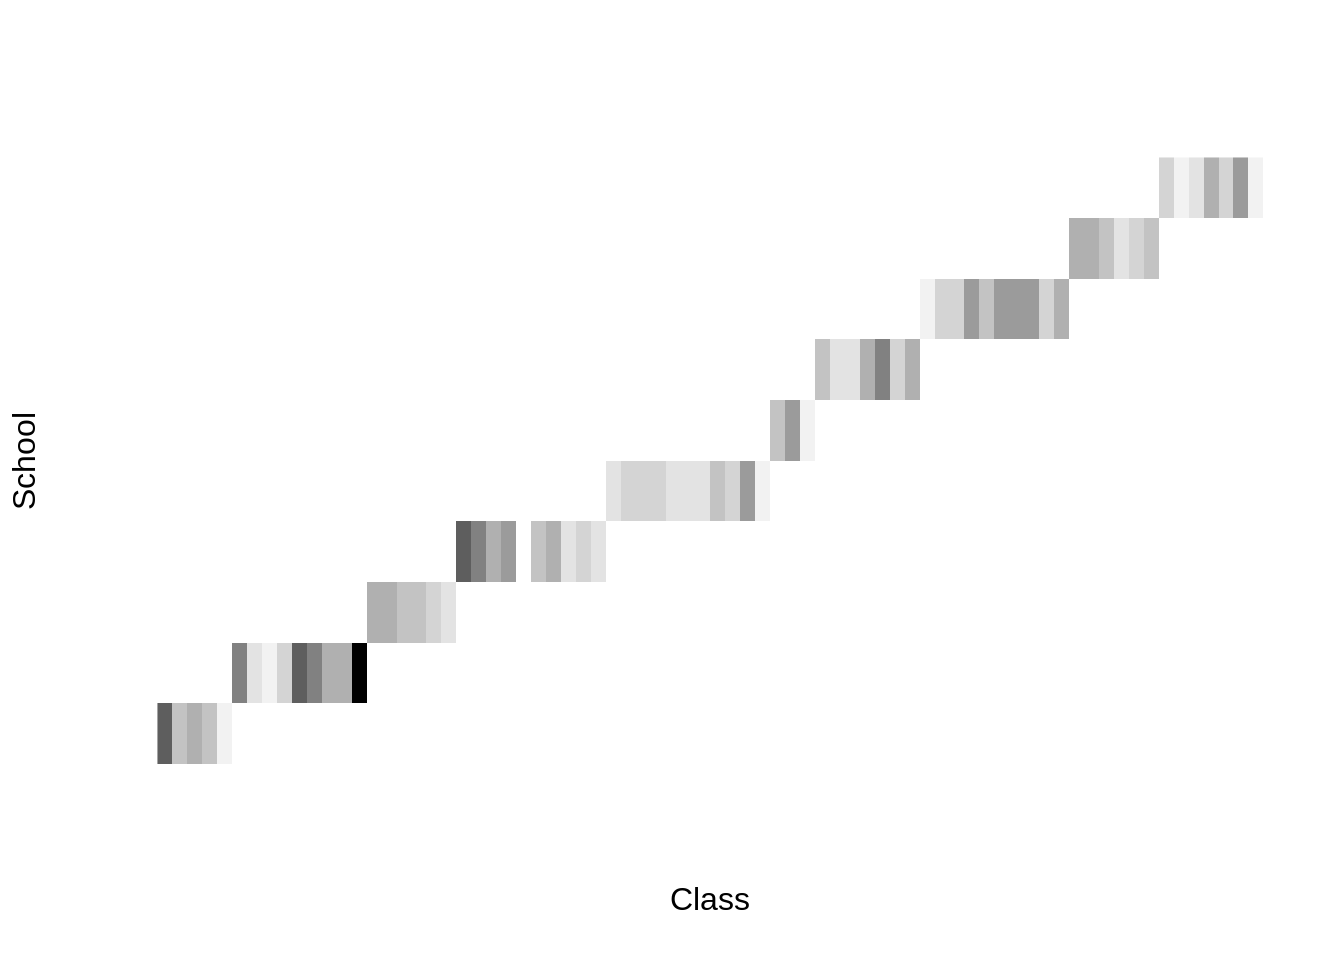
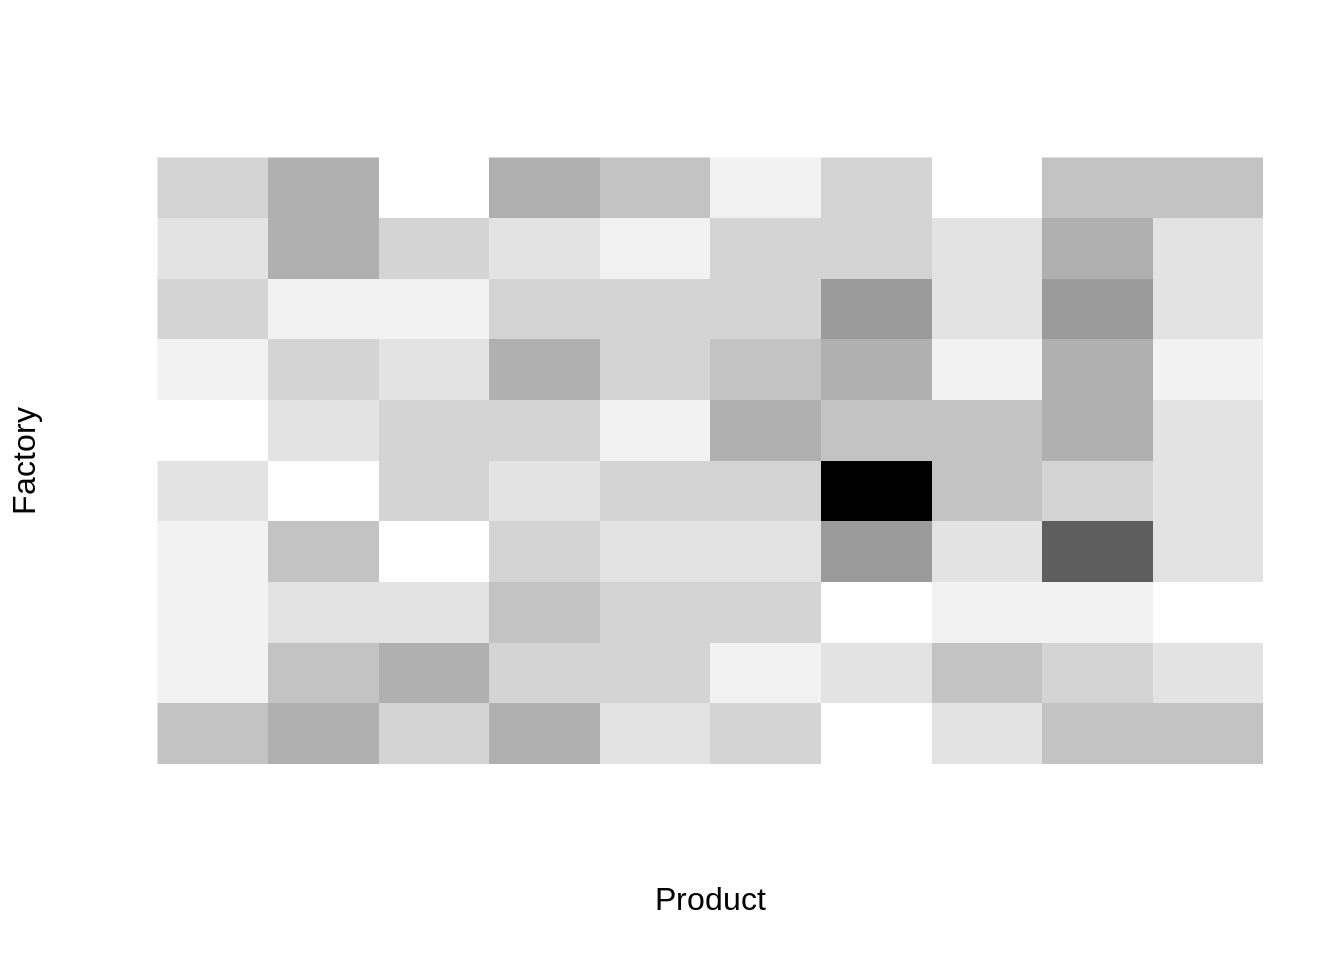
I'm thinking about plots of the form in this blog post, but it should be relatively straightforward to implement this as a pairs plot covering all pairs of grouping variables. This would be a more intuitive way for normal users to catch mistakes (whether in data wrangling or data collection/design) that lead to things being partially crossed instead of nested or fully crossed instead of depending on BlockDescription.
For reference, I've embedded the examples directly: