This is an accumulated project that will record every plotted figure in the past projects. The sense of accumulation and archiving is worth encouraging!
Each time when we want to fast plot a fantastic figure to show the results of our experiments, we need to spend a lot of time to process the data and adjust the parameters of the figure. This project is to solve this problem. We can use this project to quickly plot the figure we want, and then adjust the parameters of the figure according to our needs.
And every you create a new figure, you can save it in the project folder, so that you can use it later. This is what the archiving means.
In the following, I list some good examples about using this tool.
- A whole analysis about results

- A continuous progress to analysis


"""
@author: Zhihao Li
@date: 2024-11-16
@homepage: https://zhihaoli.top/
"""

import os
import numpy as np
import pandas as pd

from sklearn.preprocessing import Normalizer

import seaborn as sns
import matplotlib.pyplot as plt
from matplotlib.font_manager import FontProperties

import warnings
warnings.filterwarnings('ignore')class DataProcessor:
# Initialize the configuration of Data Preprocessing
def __init__(self):
self.data = None
def LoadData(self, data_path, sheet_name=0, sep=',', header=0, index_col=None):
"""LoadData Function
Input:
data_path: the path of data file
sheet_name: the table of Excel file
sep: the separate sign of csv file
header: the row of column names
index_col: the index column of data file
Output:
self.data: the data read from given data file
Function:
From given source to reach the needed data.
"""
if data_path.split('.')[-1] in ('xlsx', 'xls'):
self.data = pd.read_excel(data_path, sheet_name=sheet_name, header=header, index_col=index_col)
elif data_path.split('.')[-1] == 'csv':
self.data = pd.read_csv(data_path, sep=sep, header=header, index_col=index_col)
else:
raise Exception('Unknown data file type!')
self.PrintData()
def DataProcessing(self, date_name=None, fill_name=None, fill_method="Nearest", standard_name=None, standard_method="Zscore"):
"""DataProcessing Function
Input:
date_name: the column need to be converted to date style
fill_name: the columns need to fill the missing values
fill_method: the methods used to fill the missing values, alternatives like "Nearest"(default), "Linear", "Polynomial",
"Spline", "Mean", "Ffill", "Bfill", other specific value.
standard_name: the columns need to standardized
standard_method: the methods used to standardize the columns, alternatives like "Zscore"(default), "Minmax".
Output:
self.data: the data has been transformed
Function:
Process the data got from dat file by filling the missing values and standardize some columns.
"""
if date_name is not None:
# Assuming the date_name column has be converted to the format like "2024-1-31"
self.data[date_name] = pd.to_datetime(self.data[date_name])
if fill_name is not None:
if fill_method == "Nearest":
self.data[fill_name] = self.data[fill_name].interpolate(method="nearest")
elif fill_method == "Linear":
self.data[fill_name] = self.data[fill_name].interpolate(method="linear")
elif fill_method == "Polynomial":
self.data[fill_name] = self.data[fill_name].interpolate(method="polynomial", order=2)
elif fill_method == "Spline":
self.data[fill_name] = self.data[fill_name].interpolate(method="spline", order=2)
elif fill_method == "Mean":
self.data[fill_name] = self.data[fill_name].fillna(self.data[fill_name].mean())
elif fill_method == "Ffill":
self.data[fill_name] = self.data[fill_name].fillna(method="ffill")
elif fill_method == "Bfill":
self.data[fill_name] = self.data[fill_name].fillna(method="bfill")
else:
self.data[fill_name] = self.data[fill_name].fillna(int(fill_method))
if standard_name is not None:
stdata = self.data[standard_name]
if standard_method == "Zscore":
self.data[standard_name] = (stdata - stdata.mean()) / stdata.std()
elif standard_method == "Minmax":
self.data[standard_name] = (stdata - stdata.min()) / (stdata.max() - stdata.min())
self.PrintData()
def PrintData(self):
"""A function to print out the loaded dataframe.
Output the length of data, the first 5 elements and last 5 elements of data.
"""
print(">>> Data Length: %d" % (len(self.data)))
print(f">>> Data Head:\n{self.data.head()}")
print(f">>> Data Tail:\n{self.data.tail()}")class GraphPlotTool(DataProcessor):
# Initialize the configuration of GraphPlot Tool
def __init__(self, fname1="times.ttf", fname2="ARLRDBD.TTF"):
super().__init__()
# Set up Seaborn style
sns.set(style="whitegrid")
# Fonts style
self.title_fontsize = 12
self.label_fontsize = 10
self.fname1 = "../fonts/" + fname1
self.fname2 = "../fonts/" + fname2
self.digit_fontprop = FontProperties(fname=self.fname1)
self.title_fontprop = FontProperties(fname=self.fname2)
self.legend_fontprop = FontProperties(fname=self.fname2)
# Set colors
self.colors_name = ['yellow', 'blue', 'green', 'magenta', 'red', 'cyan', 'purple', 'orange', 'gray', 'pink']
self.colors_rgb = ['#f94144', '#f3722c', '#f8961e', '#f9844a', '#f9c74f', '#90be6d', '#43aa8b', '#4d908e', '#577590', '#277da1']
self.figsize = (12, 4)
self.dpi = 500
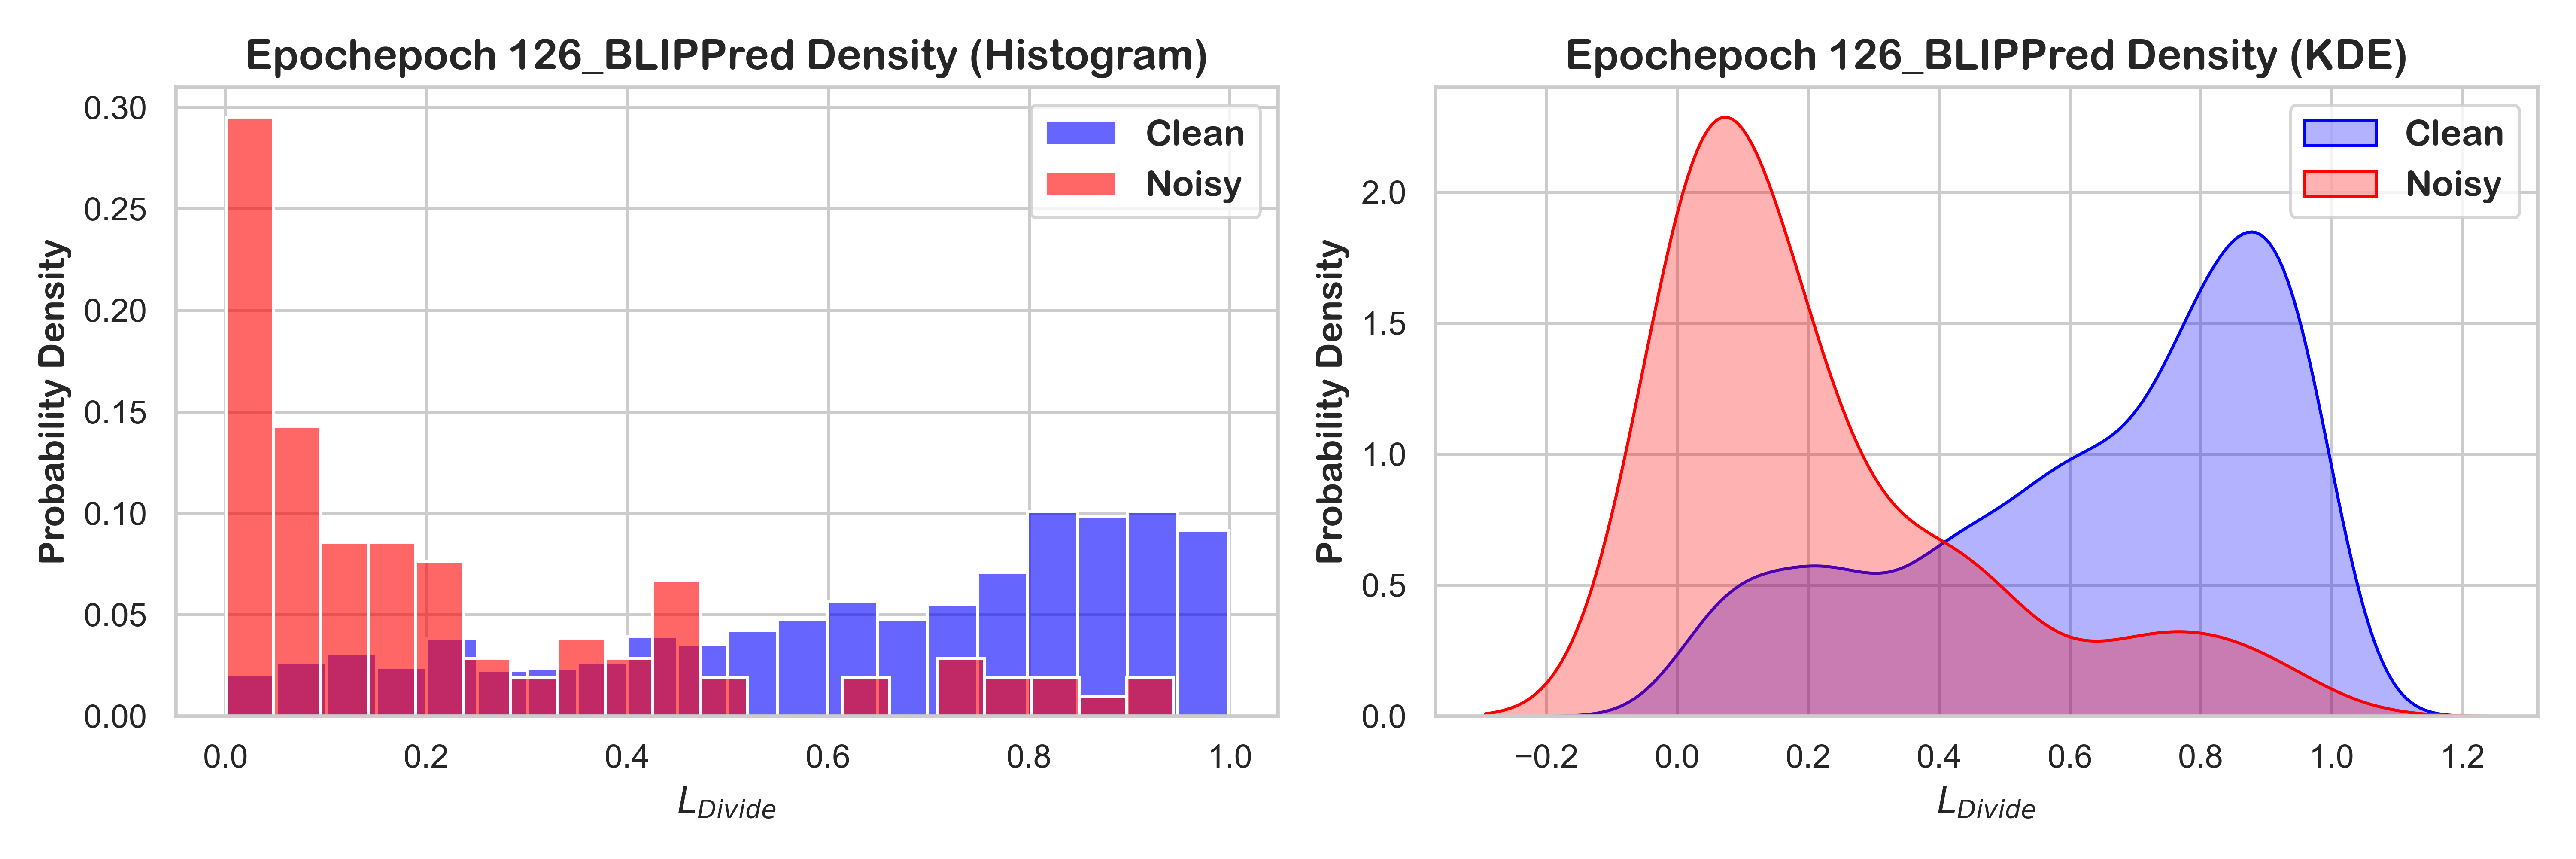
def HistKdePlot(self, image_name, data_name, data_clean, data_noisy, output_dir):
"""
Plot a Histgram compared to a Kde according by row.
params:
image_name: the name of image file.
data_names: a string list has the shape of (rows, cols).
data_clean: a sub-dataset in a sub-graph.
data_noisy: another sub-dataset in a sub-graph.
output_dir: the directory to save the images.
"""
fig, axes = plt.subplots(1, 2, figsize=(12, 4), dpi=self.dpi)
# histplot for sub-figure1
sns.histplot(data_clean, color="blue", label="Clean", kde=False, stat="probability", bins=20, alpha=0.6, ax=axes[0])
sns.histplot(data_noisy, color="red", label="Noisy", kde=False, stat="probability", bins=20, alpha=0.6, ax=axes[0])
axes[0].set_title(f'{data_name} Density (Histogram)', fontproperties=self.title_fontprop, fontsize=self.title_fontsize+2)
axes[0].set_xlabel(r'$L_{Divide}$', fontproperties=self.title_fontprop, fontsize=self.label_fontsize+2)
axes[0].set_ylabel('Probability Density', fontproperties=self.title_fontprop, fontsize=self.label_fontsize+2)
axes[0].legend(prop=self.legend_fontprop)
# kdeplot for sub-figure2
sns.kdeplot(data_clean, color="blue", label="Clean", fill=True, ax=axes[1], alpha=0.3)
sns.kdeplot(data_noisy, color="red", label="Noisy", fill=True, ax=axes[1], alpha=0.3)
axes[1].set_title(f'{data_name} Density (KDE)', fontproperties=self.title_fontprop, fontsize=self.title_fontsize+2)
axes[1].set_xlabel(r'$L_{Divide}$', fontproperties=self.title_fontprop, fontsize=self.label_fontsize+2)
axes[1].set_ylabel('Probability Density', fontproperties=self.title_fontprop, fontsize=self.label_fontsize+2)
axes[1].legend(prop=self.legend_fontprop)
plt.tight_layout()
folder_path = os.path.join(output_dir)
if not os.path.exists(folder_path):
os.makedirs(folder_path)
plt.savefig(os.path.join(folder_path, f"{image_name}.png"), format="png")
plt.show()
def HistComparePlot(self, image_name, data_names, data_clean, data_noisy, output_dir):
"""
Plot multiple Histgrams to compare by row.
params:
image_name: the name of image file.
data_names: a string list has the shape of (rows, cols).
data_clean: a sub-dataset in a sub-graph.
data_noisy: another sub-dataset in a sub-graph.
output_dir: the directory to save the images.
"""
rows, cols = len(data_names), len(data_names[0])
legend_fontprop = FontProperties(fname=self.fname2, size=8)
fig, axes = plt.subplots(rows, cols, figsize=(12, 4), dpi=self.dpi)
for row in range(rows):
for col in range(cols):
sub_clean, sub_noisy = data_clean[row][col], data_noisy[row][col]
# histplot for sub-figure
sns.histplot(sub_clean, color="blue", label="Clean", kde=False, stat="probability", bins=20, alpha=0.6, ax=axes[row, col])
sns.histplot(sub_noisy, color="red", label="Noisy", kde=False, stat="probability", bins=20, alpha=0.6, ax=axes[row, col])
axes[row, col].set_title(f'{data_names[row][col]}', fontproperties=self.title_fontprop, fontsize=self.title_fontsize)
axes[row, col].set_xlabel('')
axes[row, col].set_ylabel('')
axes[row, col].legend(prop=legend_fontprop)
for col in range(cols):
axes[1, col].set_xlabel(r'$Score_{BLIP}$', fontproperties=self.title_fontprop, fontsize=self.label_fontsize)
for row in range(rows):
axes[row, 0].set_ylabel('Probability Density', fontproperties=self.title_fontprop, fontsize=self.label_fontsize)
plt.tight_layout()
# save the image
folder_path = os.path.join(output_dir)
if not os.path.exists(folder_path):
os.makedirs(folder_path)
plt.savefig(os.path.join(folder_path, f"{image_name}.png"), format="png")
plt.show()