Using PyCharm debug mode and breakpoints with pytorch-lightning? #8810
Unanswered
jpilaul
asked this question in
DDP / multi-GPU / multi-node
Replies: 3 comments
-
|
Big +1 for this. It's very tedious to have to use print statements within my lightning code rather than simply using the PyCharm debugger. Why is this happening??? |
Beta Was this translation helpful? Give feedback.
0 replies
-
|
I had the same problem. The solution was to set num_workers to 0 while creating the DataLoader object, then it works like normal. |
Beta Was this translation helpful? Give feedback.
0 replies
-
|
I'm having the same issue |
Beta Was this translation helpful? Give feedback.
0 replies
Sign up for free
to join this conversation on GitHub.
Already have an account?
Sign in to comment
Uh oh!
There was an error while loading. Please reload this page.
-
How can we use PyCharm debugging mode on pytorch-lightning. I am using the latest pytorch-lightning version. At the moment, when I use debug mode, I am unable to view
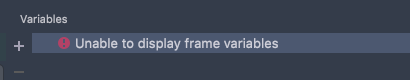
Variables. I think that it's related to a distributed training bug in PyCharm/pytorch debugging mode (https://youtrack.jetbrains.com/issue/PY-39489). It first says "Collecting data" and then I see the following:I have tried setting
gpus=1but it still hangs at "Collecting data".Beta Was this translation helpful? Give feedback.
All reactions