Index out of bounds error with certain dataset in Line graph #18
Description
Steps to reproduce
run the following script:
ipmo Graphical
$TestData = @(
146.2869, 125.8676, 131.6403, 126.1095, 125.2327, 129.3879, 121.1957, 121.1715, 133.5654, 123.1936, 121.2738, 128.1564, 115.8329, 120.6185, 129.975
119.184, 127.2515, 121.1354, 127.3241, 130.5228, 139.8449, 119.9533, 127.9957, 121.745, 120.0916, 134.3705, 117.8509, 128.0231, 119.3807, 129.5753
117.3724, 122.7834, 126.122, 120.2665, 120.1368, 119.297, 114.8186, 117.6453, 120.0503, 117.5853, 123.487, 122.6258, 130.8383, 123.5863, 120.5457
130.3574, 119.6901, 120.0723, 130.4798, 122.0327
)
Show-Graph -Datapoints $TestData -Type Bar
Show-Graph -Datapoints $TestData -Type Scatter
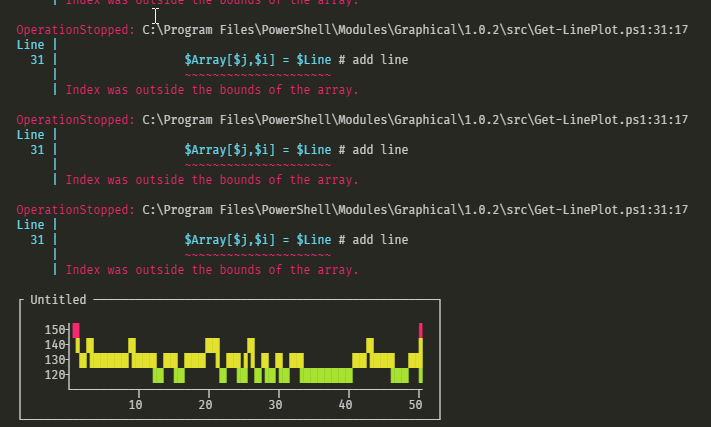
Show-Graph -Datapoints $TestData -Type LineExpected result
it should show all three types of graphs without errors
Actual result
all three graph types are shown, but there are some errors for the Line graph
Additional information
Bar and Scatter graphs are shown without errors for the exact same dataset
VersionInfo
Graphical Module:
1.0.2
Powershell
PSVersion 7.0.2
PSEdition Core
GitCommitId 7.0.2
OS Microsoft Windows 10.0.18363
Platform Win32NT
PSCompatibleVersions {1.0, 2.0, 3.0, 4.0…}
PSRemotingProtocolVersion 2.3
SerializationVersion 1.1.0.1
WSManStackVersion 3.0
OS
Windows 10 Pro
Version 1909