SO stops showing events after several hours. - Resolved??? #2581
Replies: 6 comments 11 replies
-
|
What does the logstash log say? |
Beta Was this translation helpful? Give feedback.
-
|
I don't see anything that stands out in the Elasticsearch log. There were some complaints when it was rebooting, but I have no idea if they are pertinent to the issue. I'll try to attach the log file for 1/9. The last event recorded before rebooting was at 11:09:54 UTC. The machine was rebooted at 17:52 UTC. |
Beta Was this translation helpful? Give feedback.
-
|
I may be missing something, but it appears that the attached archive is empty. |
Beta Was this translation helpful? Give feedback.
-
|
Sorry about that. Here is an uncompressed version of the file. |
Beta Was this translation helpful? Give feedback.
-
|
Wes, From ps -aux Latest entries in redis-server.log: |
Beta Was this translation helpful? Give feedback.
-
|
Looking at logstash logs. Don't know if this is anything, but logstash appears to start sucessfully on the 11th at 22:44. There are no more messages for 20 hours until on the 12th at 19:12 when these messages start to appear. They continue throughout the rest of the 12th and into the 13th. Kibana stops showing events after 20:12 on the 13th. [2021-01-12T19:12:58,160][INFO ][logstash.outputs.elasticsearch] retrying failed action with response code: 500 ({"type"=>"illegal_state_exception", "reason"=>"Pipeline processor configured for non-existent pipeline [suricata.]"}) ... [2021-01-13T23:59:59,067][INFO ][logstash.outputs.elasticsearch] retrying failed action with response code: 500 ({"type"=>"illegal_state_exception", "reason"=>"Pipeline processor configured for non-existent pipeline [suricata.]"}) |
Beta Was this translation helpful? Give feedback.
-
|
FWIW I've experienced the same thing. I've only got a 1TB drive and I just put it down to the system running out of things it can purge before eventually running out of space. I always rectify it with a so-elastic-clear which isn't ideal but I don't have the system in production so I'm fine with losing the logs. Same symptoms as above, redis queue goes through the roof, processor goes to 100%, nothing new shows in Kibana/Alerts/Hunt. The only way to bring it back is reducing disk usage below 90%. I haven't seen this happen since upgrading to 2.3.21 but I'll see if it happens again. My disk space constantly hovers at 90% as I assume some processes are going on to trim things like pcaps to make space. Eventually ES takes over all the space though as I think the shortest retention is 30 days and it never gets there? |
Beta Was this translation helpful? Give feedback.
-
|
Thanks, I might try the so-elastic-clear command next time it has a problem. Its been a couple of weeks since the initial install and /nsm is up to 51%. I haven't seen high processor usage when the problem occurs either. Processor usage is normally about 20% for all four cores. Have you noticed an increase in virtual memory usage for elastic search, as shown by htop? Mine continues to increase. Its currently at 19.5G on a 16G machine. I notice an increase after each reboot when the problem occurs. It would also be interesting to know what OS you are using. Just trying to find a commonality that may be causing this. If you're using Ubuntu I might try reinstalling with the baseline CentOS. Might do that anyway. |
Beta Was this translation helpful? Give feedback.
-
|
I also have a problem where SO stops showing alerts and sensor data. But in this case all communication with the heavy nodes stop, leading to the hunt and sensor interface to hang forever. So not sure if we are seeing the same problem. Running Ubuntu 18.04LTS and SO 2.3.21 |
Beta Was this translation helpful? Give feedback.
-
|
Thank for the info. I'll take a look. |
Beta Was this translation helpful? Give feedback.
-
@trocade, please start a new thread. |
Beta Was this translation helpful? Give feedback.
-
|
Mine just filled up overnight and stopped. 1TB drive. Perhaps this is not the same issue you are seeing if your drive isn't actually filling up. Should I start a new thread? Basically my disk usage hovers at 90% until eventually something breaks and it fills up. |
Beta Was this translation helpful? Give feedback.
-
|
Please start a new thread, as it appears that it may be a different issue. |
Beta Was this translation helpful? Give feedback.
-
|
The "Problem" has not occurred for over a week now. Removed a BPF rule that I had added to the end of the file: /opt/so/saltstack/local/pillar/minions/sopc_standalone.sls nids: The purpose of this rule was to remove alerts caused by Chromecast devices constantly pinging the router. The rule seemed to work. There were no more ping alerts. When the problem occurred, logstash.log had the following, constantly reoccurring log messages: [2021-01-09T03:10:02,809][INFO ][logstash.outputs.elasticsearch] retrying failed action with response code: 500 ({"type"=>"illegal_state_exception", "reason"=>"Pipeline processor configured for non-existent pipeline [suricata.]"}) Haven't seen any of these log messages either. I'll live with the ping alerts. Much better than having SO stop showing data. Frank V. |
Beta Was this translation helpful? Give feedback.
-
|
same issue here , any solution ? the SO just stop after a few hours with the alert on influxdb " high redis memory usage" , im using SO 2.4 error=>{"type"=>"illegal_state_exception", "reason"=>"Pipeline processor configured for non-existent pipeline [suricata.ike]"}} |
Beta Was this translation helpful? Give feedback.
Uh oh!
There was an error while loading. Please reload this page.
Uh oh!
There was an error while loading. Please reload this page.
-
Hi,
Having a problem with SO 2.3.21. For the last couple of days S.O. stops displaying any newly collected events after some point in time. For example I checked it this morning. In Kibana Discover, there were events showing up to about 00:09 local time (PST), and nothing, no events after that point in time. SO is capturing and storing events because after rebooting the events usually show up. (Sometimes it takes 2 reboots.) Alerts are missing as well when this occurs but appear after a reboot.
This is for a network install of SO 2.3.21 as standalone on Ubuntu 18.04.5 Server. SO was installed about three weeks ago with the following options:
Grafana-Yes, OSQuery-Yes, Wazuh-Yes, TheHive-No, PlayBook-No, Strelka-No
Its running on a Dell T30 with a 4 core Xeon E3-1225, 16GB RAM, 1TB SSD (Samsung EVO 860).
SSD was partitioned as recommended in the S.O. 2.3 documentation.
I'm suspecting that SO needs more RAM, but I really don't know if something else is going on. I wouldn't be surprised if Ubuntu starts off using more memory than Cent OS so maybe SO on Cent OS with 16 GB works, while SO on Ubuntu does not, ???
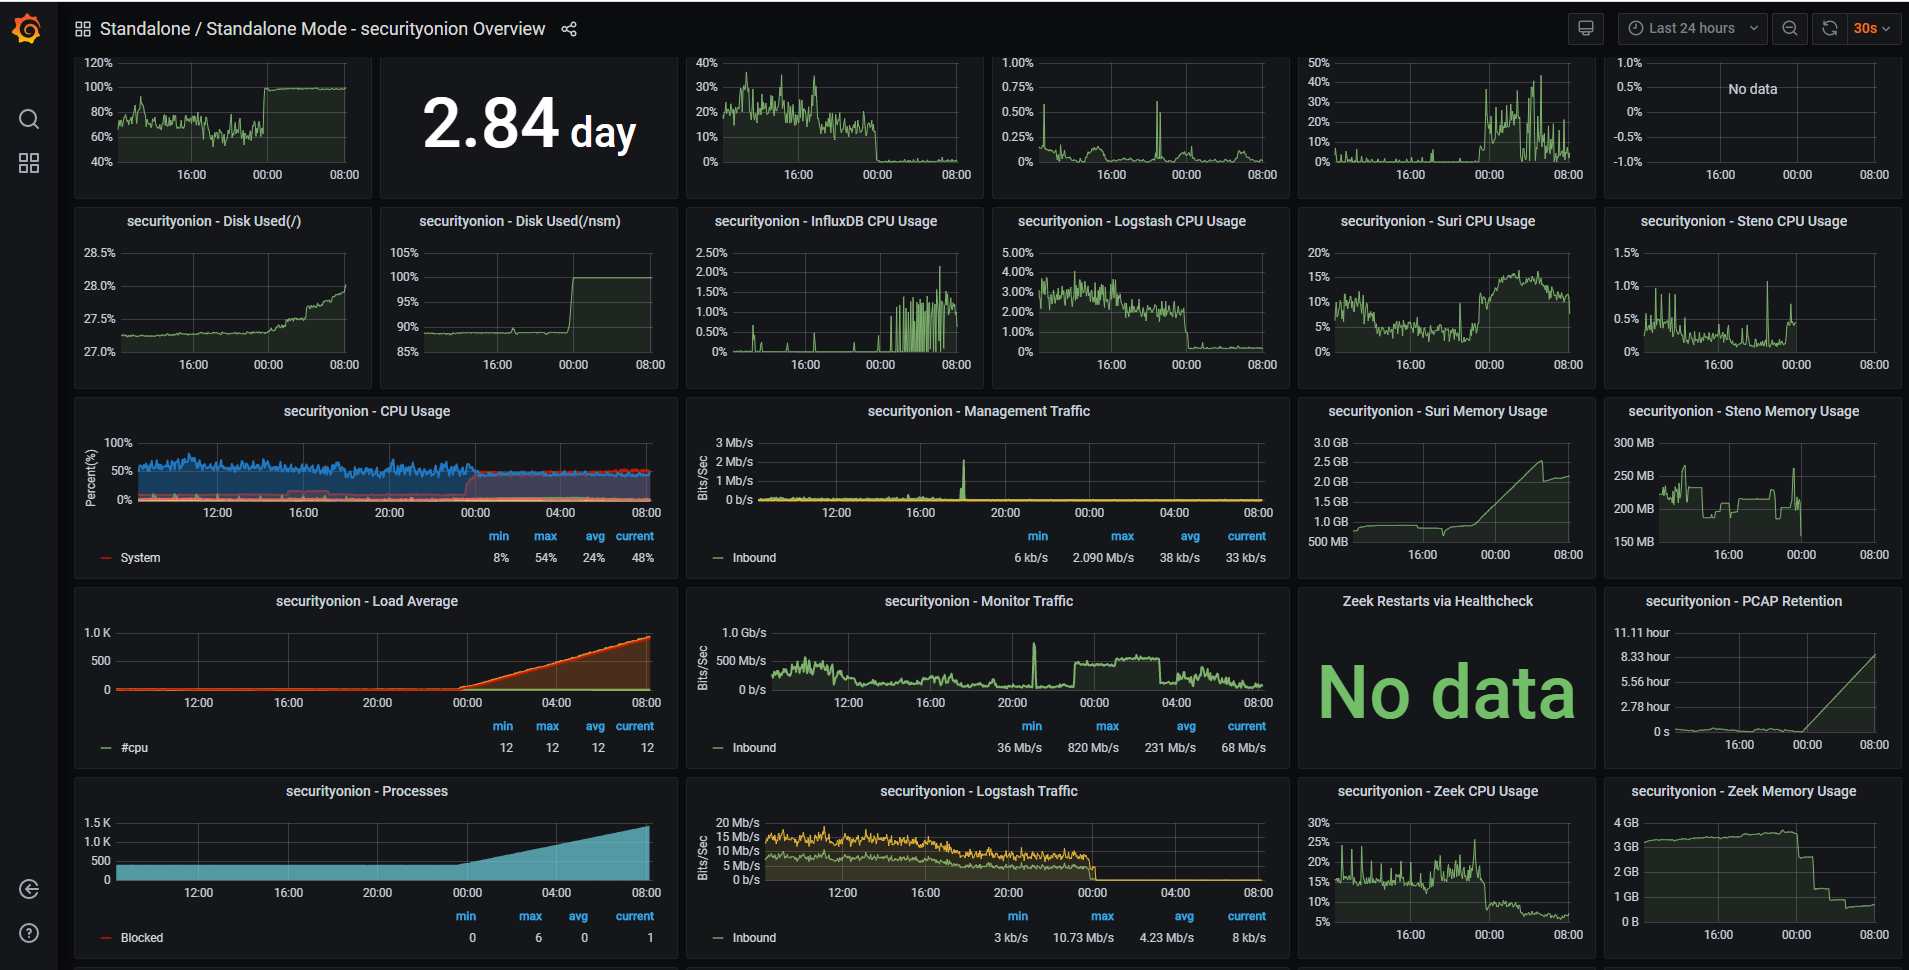
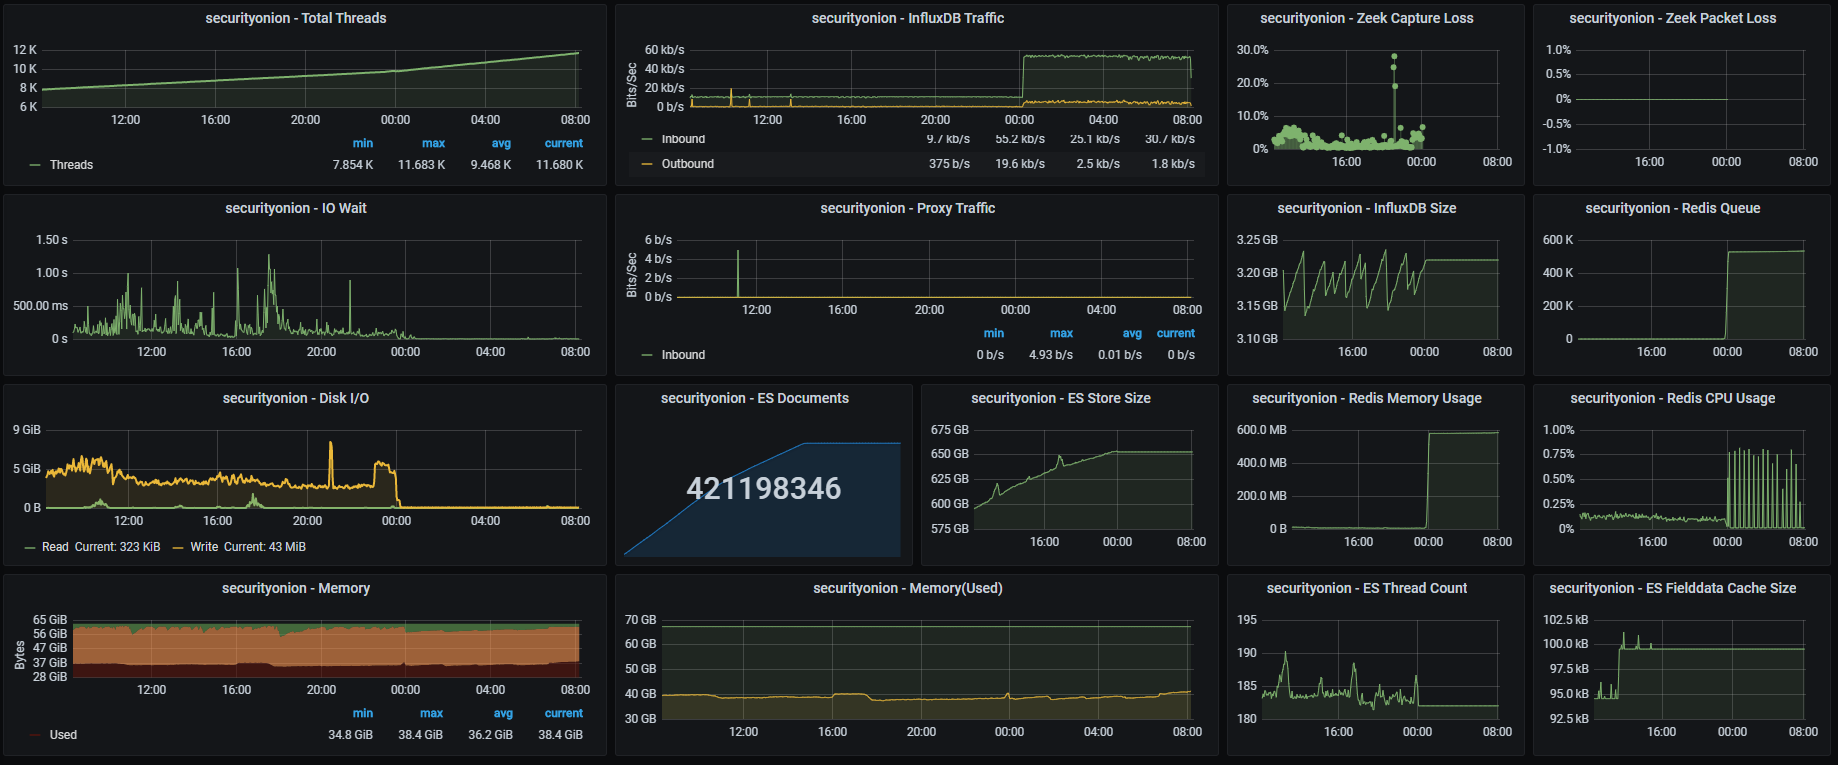
After a problem occurs Grafana shows continuously increasing Redis memory usage and queue values. This morning Redis memory was at 200.27 MB, and the queue at 169.5 K. Normally Redis memory usage is around 6 MB, and the queue value is at 0.
ES Documents and ES Store Size are always increasing when SO is running properly. During the 'problem' both are flat.
Memory graph on Grafana shows slowly increasing memory utilization during SO operation. Below are the memory usage values when a failure occurred for two days.
1/7 10.46 GB, 10.11 after reboot
1/8 10.47 GB, 10.10 after reboot
Although currently (SO seems to be working) memory usage is at 10.52 GB, Buffered 1.02 GB, Cached 3.61 GB, Free 373 MB.
During a failure, prior to rebooting, so-status shows all green, everything is OK.
Running salt-call state.highstate yields:
Succeeded: 495 (changed=12)
Failed: 0
I'm using a non-standard SSH port, and have BPF filters in /opt/so/saltstack/local/pillar/minions/sopc_standalone.sls for senographer and suricata.
Htop shows an ever increasing Virtual memory allocation for /usr/share/elasricsearch/jdk/bin/java. Sometime after installing S.O. it was around 12G. Now its at 18.3G. It seems to be higher after every reboot.
I'm also seeing continuous warnings in Alerts of: 'Apparmor Denied',
Jan 9 02:20:00 sopc kernel: [24041.238449] audit: type=1400 audit(1610158800.069:817): apparmor="DENIED" operation="ptrace" profile="docker-default" pid=6236 comm="telegraf" requested_mask="trace" denied_mask="trace" peer="unconfined"
Any recommendations on how to proceed would be appreciated.
Thank you,
Frank V.
Beta Was this translation helpful? Give feedback.
All reactions