after a while installing security onion alerts stop working #5375
-
|
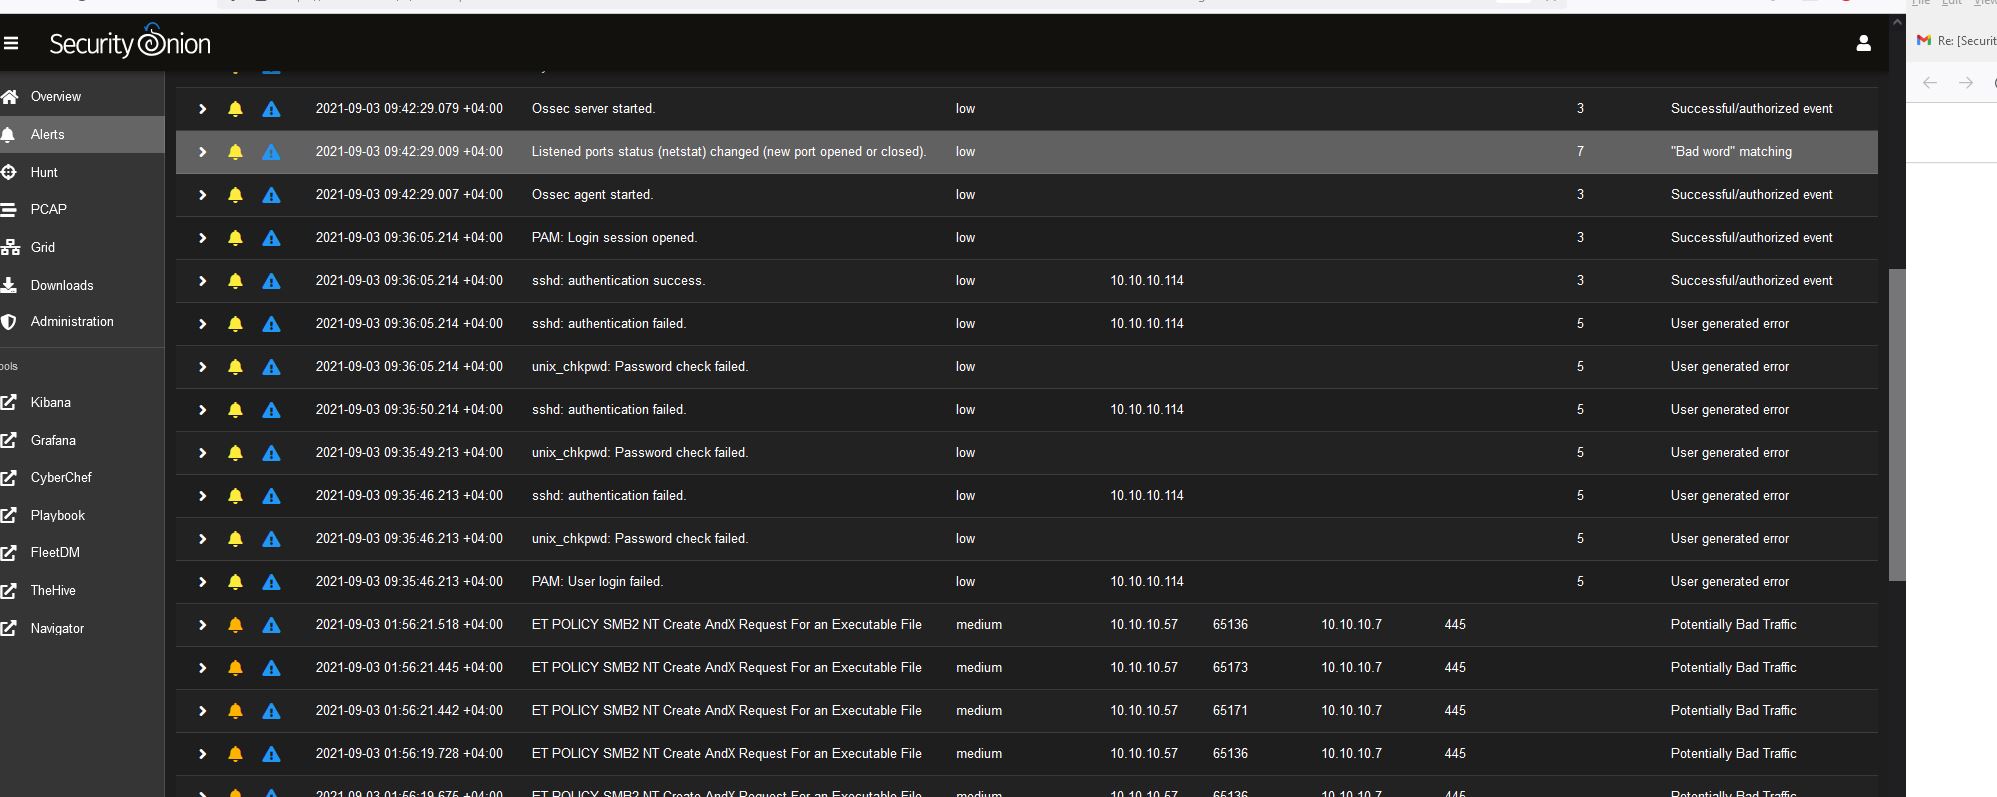
I have tried the installation both a vm and a separate machine, I still get the error did not complete please see the logs, however security onion run successfully and alerts works for a while then it stop working all together see screenshot, please help, thanks I also noticed when this alert comes up: Listened ports status (netstat) changed (new port opened or closed) it seems to stop showing alerts after. just to add when logged in Kibana the alerts show except on security onion not showing any alert |
Beta Was this translation helpful? Give feedback.
Replies: 9 comments 3 replies
-
|
I don't see any screenshot. Please review #1720 and include the following information:
|
Beta Was this translation helpful? Give feedback.
-
|
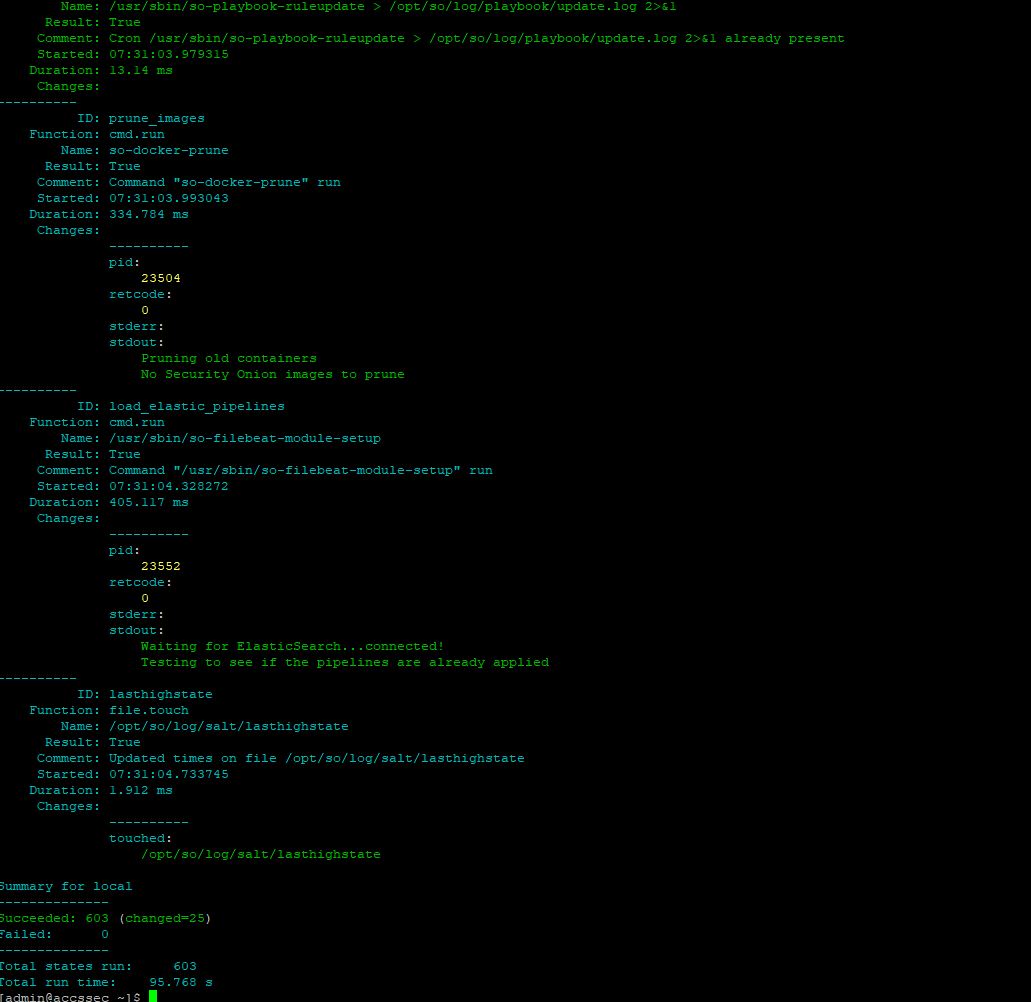
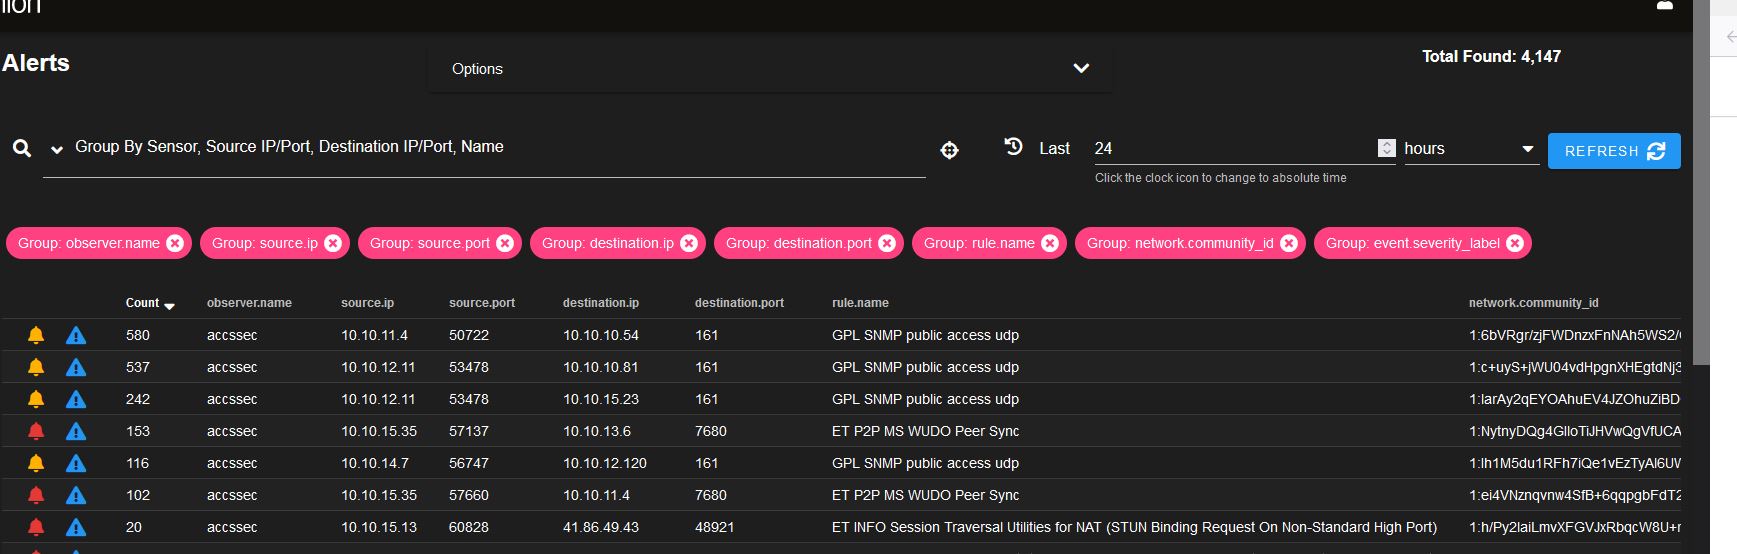
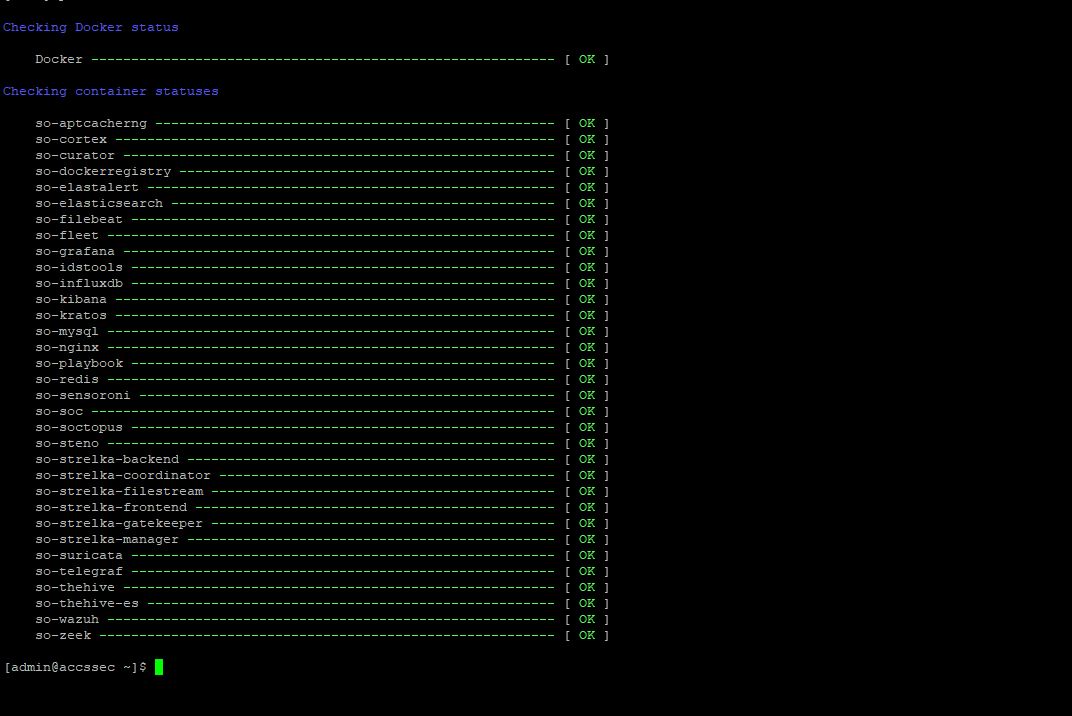
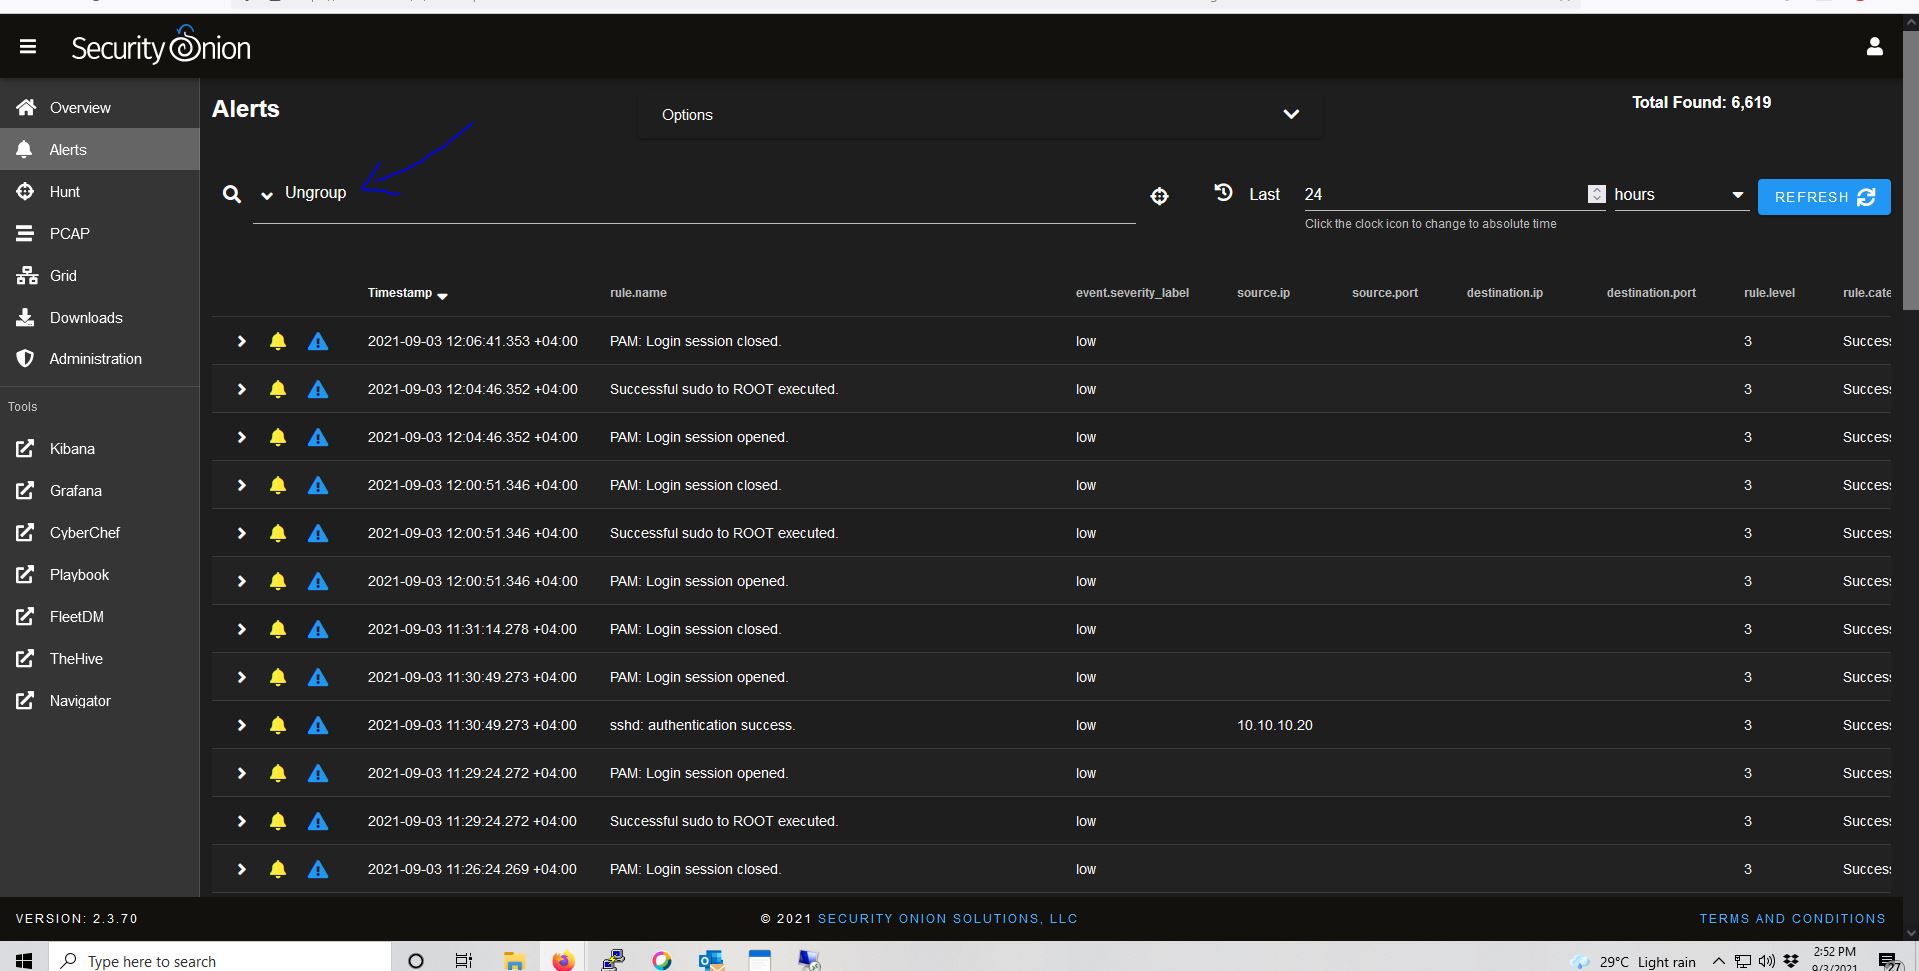
I am using version 2.3.70 of security onion, I re-downloaded the latest version (2.3.70-WAZUH ISO image) all installed successfully, but this time around the same problem when I monitor via ungroup it works for a while then the alert stop showing but however when using alert by (Group By Sensor, Source IP/Port, Destination IP/Port, Name) I do see it is showing the alert but my issue with using this alert is there is no time with it that is why I want to use ungroup that gives me the time of the alert see the screenshots attached. the installation of security onion I used on a stand alone using a pendrive that copied security onion with balenaEtcher software as recommended on the security onion website. installation type I used evaluation mode for testing first but then I wanted to use a standalone for my environment. all services are running without any errors see screenshot when running salt-call state.highstate no errors see screenshot:
no failures on the grid status
|
Beta Was this translation helpful? Give feedback.
-
|
I want to be able to do live monitoring that includes all of the alerts, it seem to work for few hours then stop |
Beta Was this translation helpful? Give feedback.
-
I'm not sure I understand your description of the problem. Are you asking about the For more information, please see: |
Beta Was this translation helpful? Give feedback.
-
|
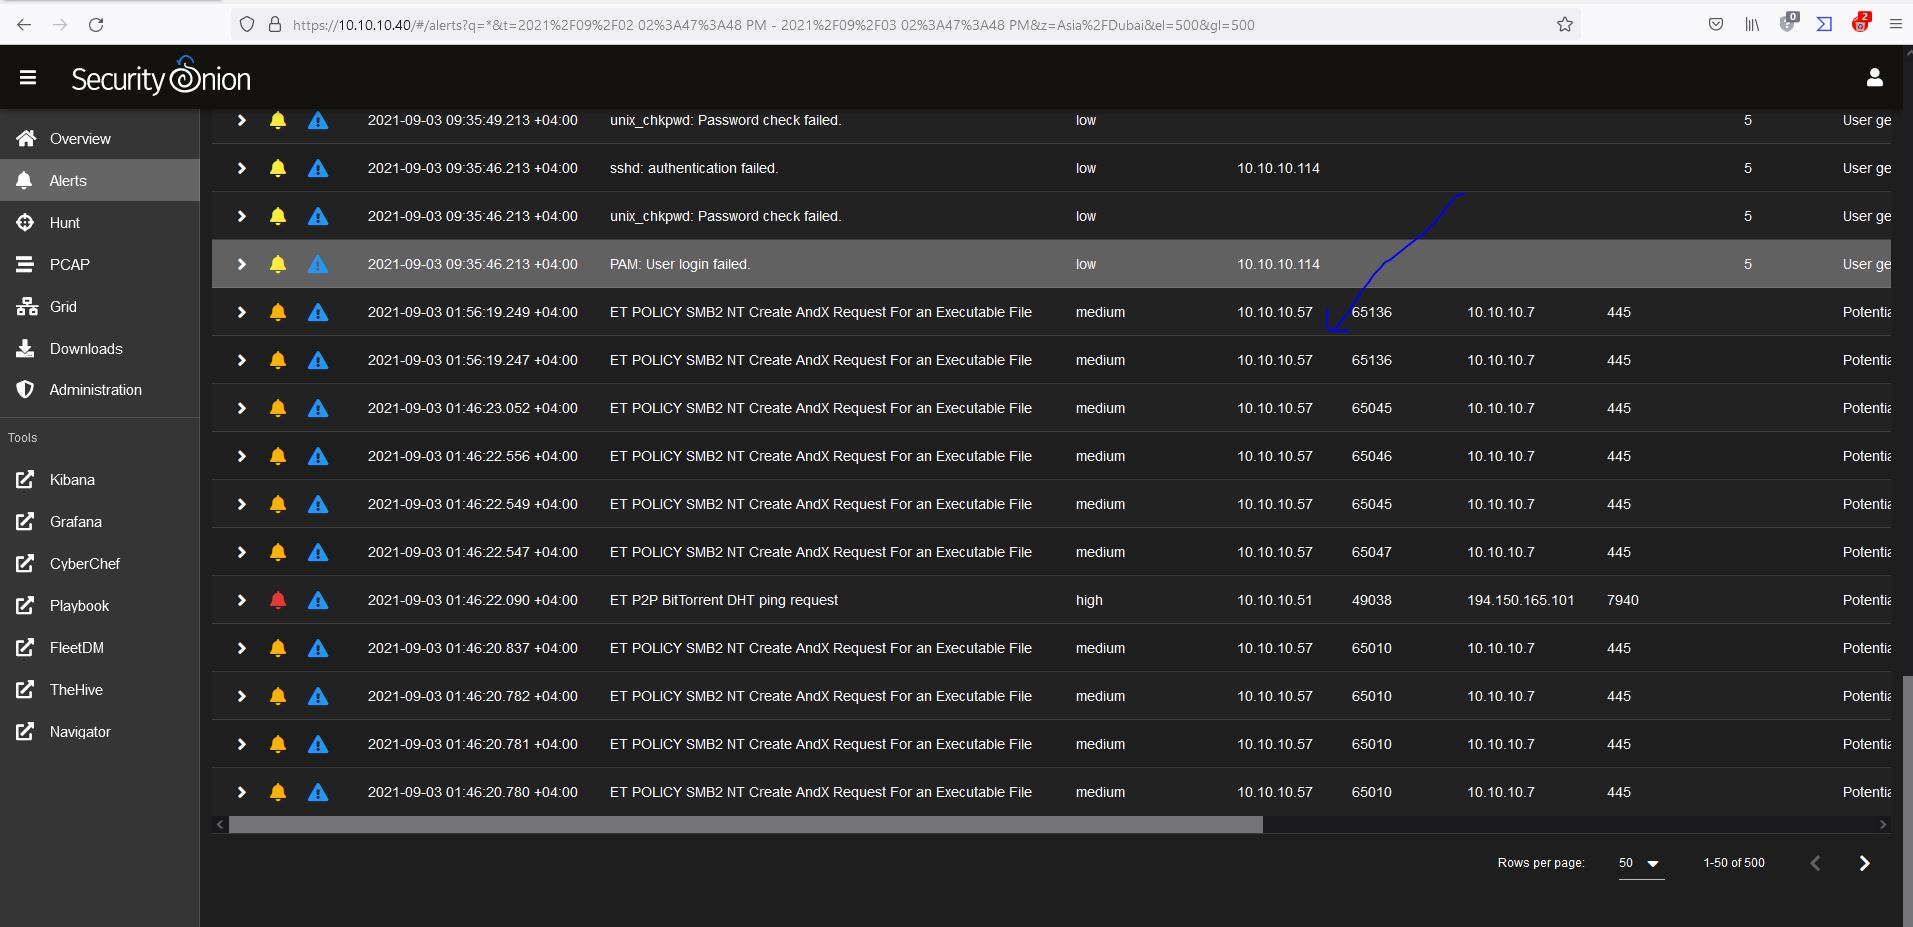
before I receiving these alerts when I select the ungroup option under alerts:
and now I only see this
is there a way I can see all the HIDS alerts including the IP source and destination, plus the time and date? I just dont understand why before it was showing live alerts with time relevant to my current PC+ source ip and destination ip , then suddenly it stops regards, Paul |
Beta Was this translation helpful? Give feedback.
-
|
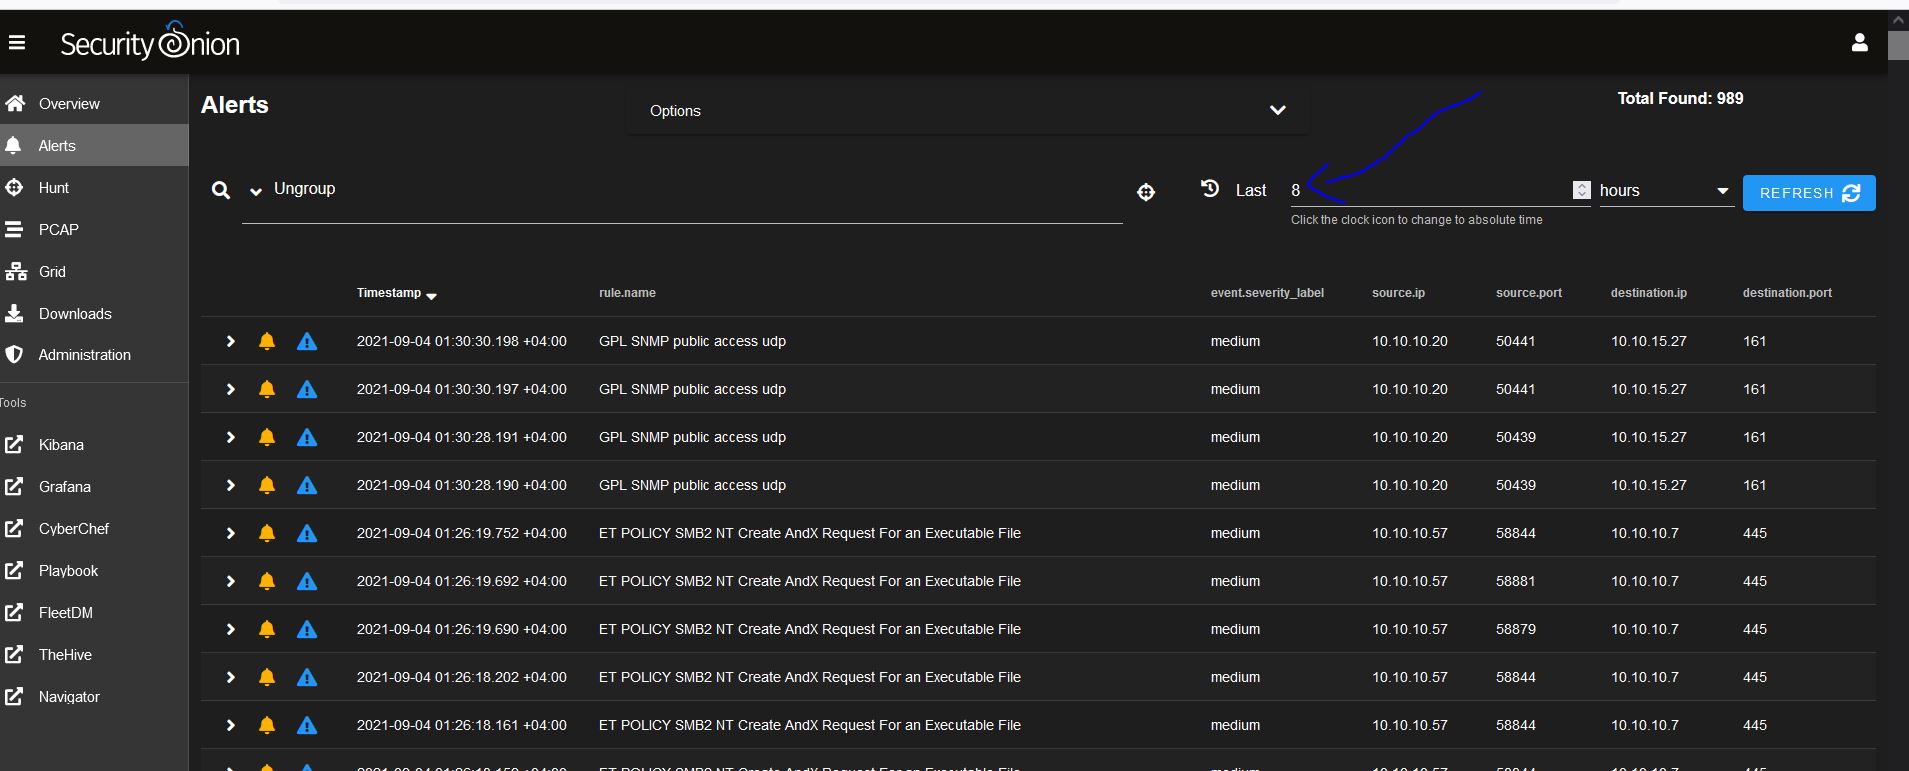
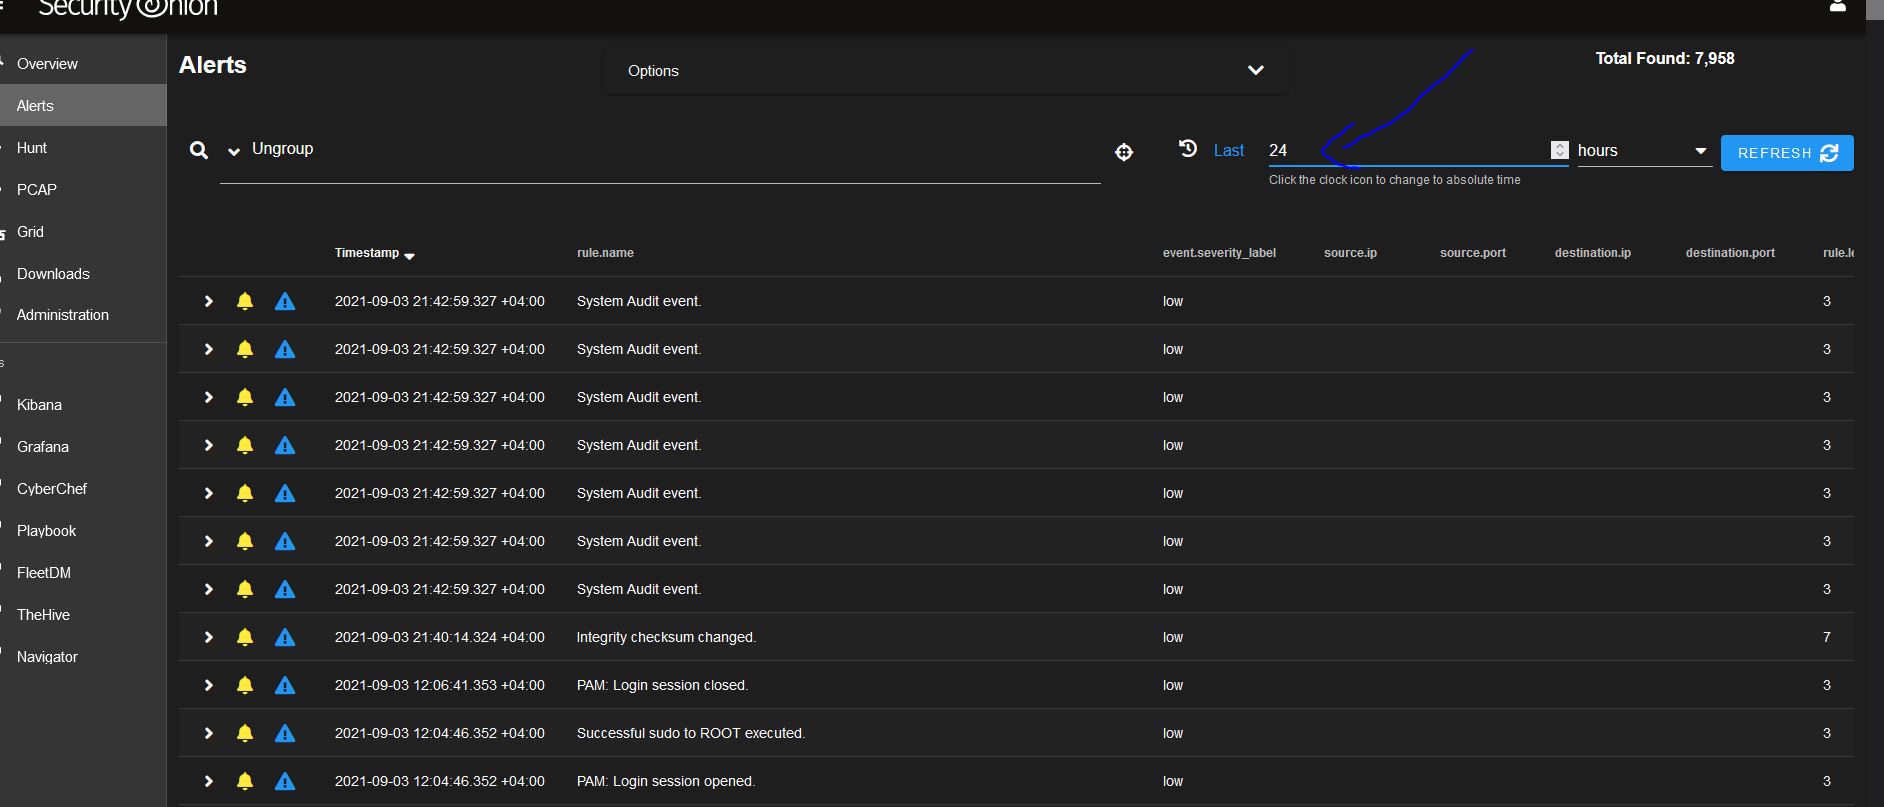
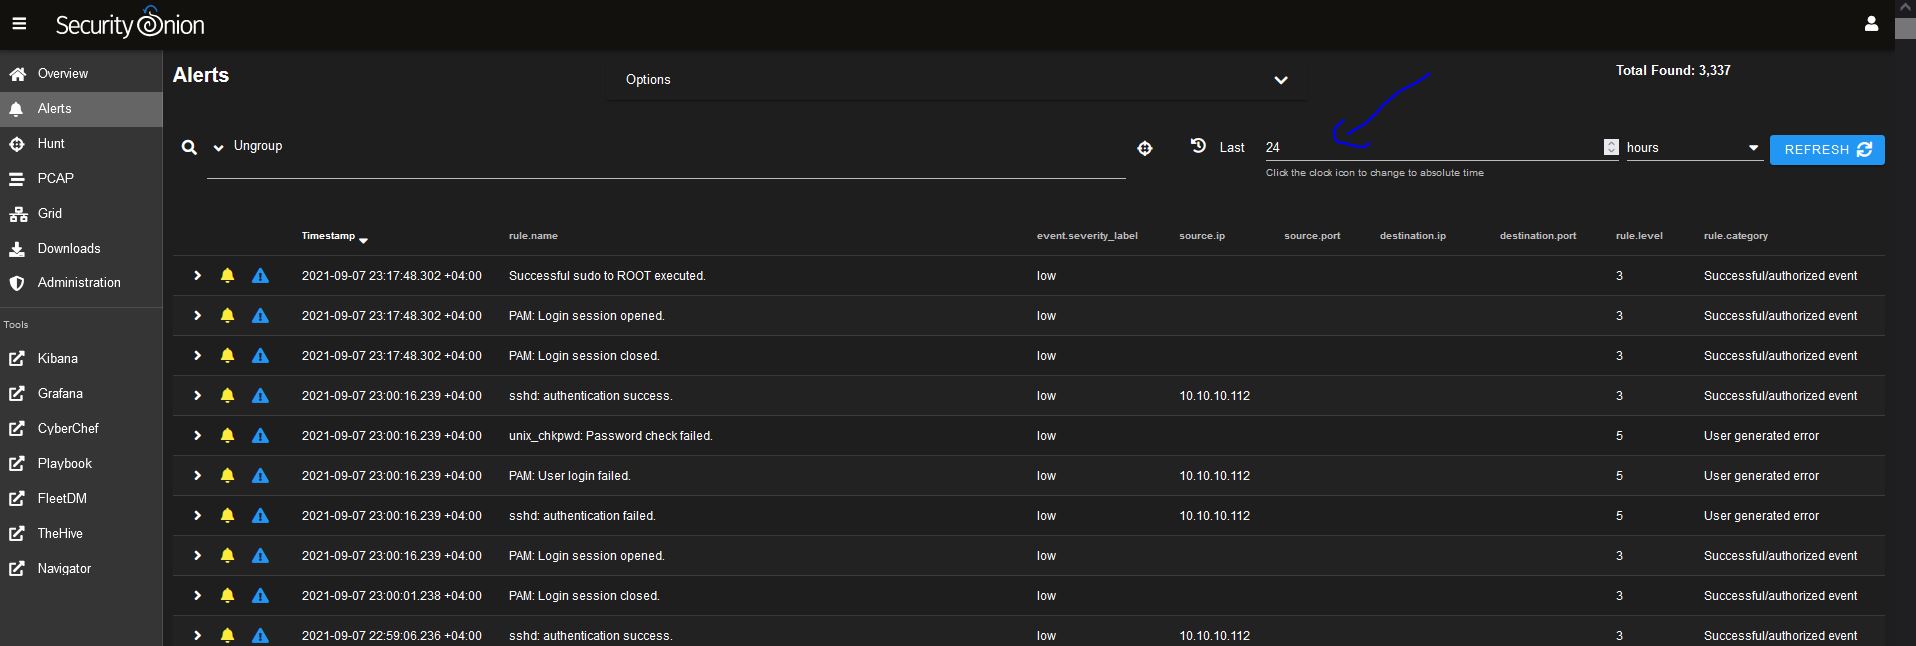
After messing around with the settings I noticed this, when set to 8 hours the alerts shows but if I set it back to 24 hours no alerts, see the screenshots. Is there some-kind of limit on the logs? or is it maybe that it is using the CentOS time instead of the browser time ?
|
Beta Was this translation helpful? Give feedback.
-
|
In the Ungrouped view, scroll all the way down to the bottom of the page and you should see a |
Beta Was this translation helpful? Give feedback.
-
|
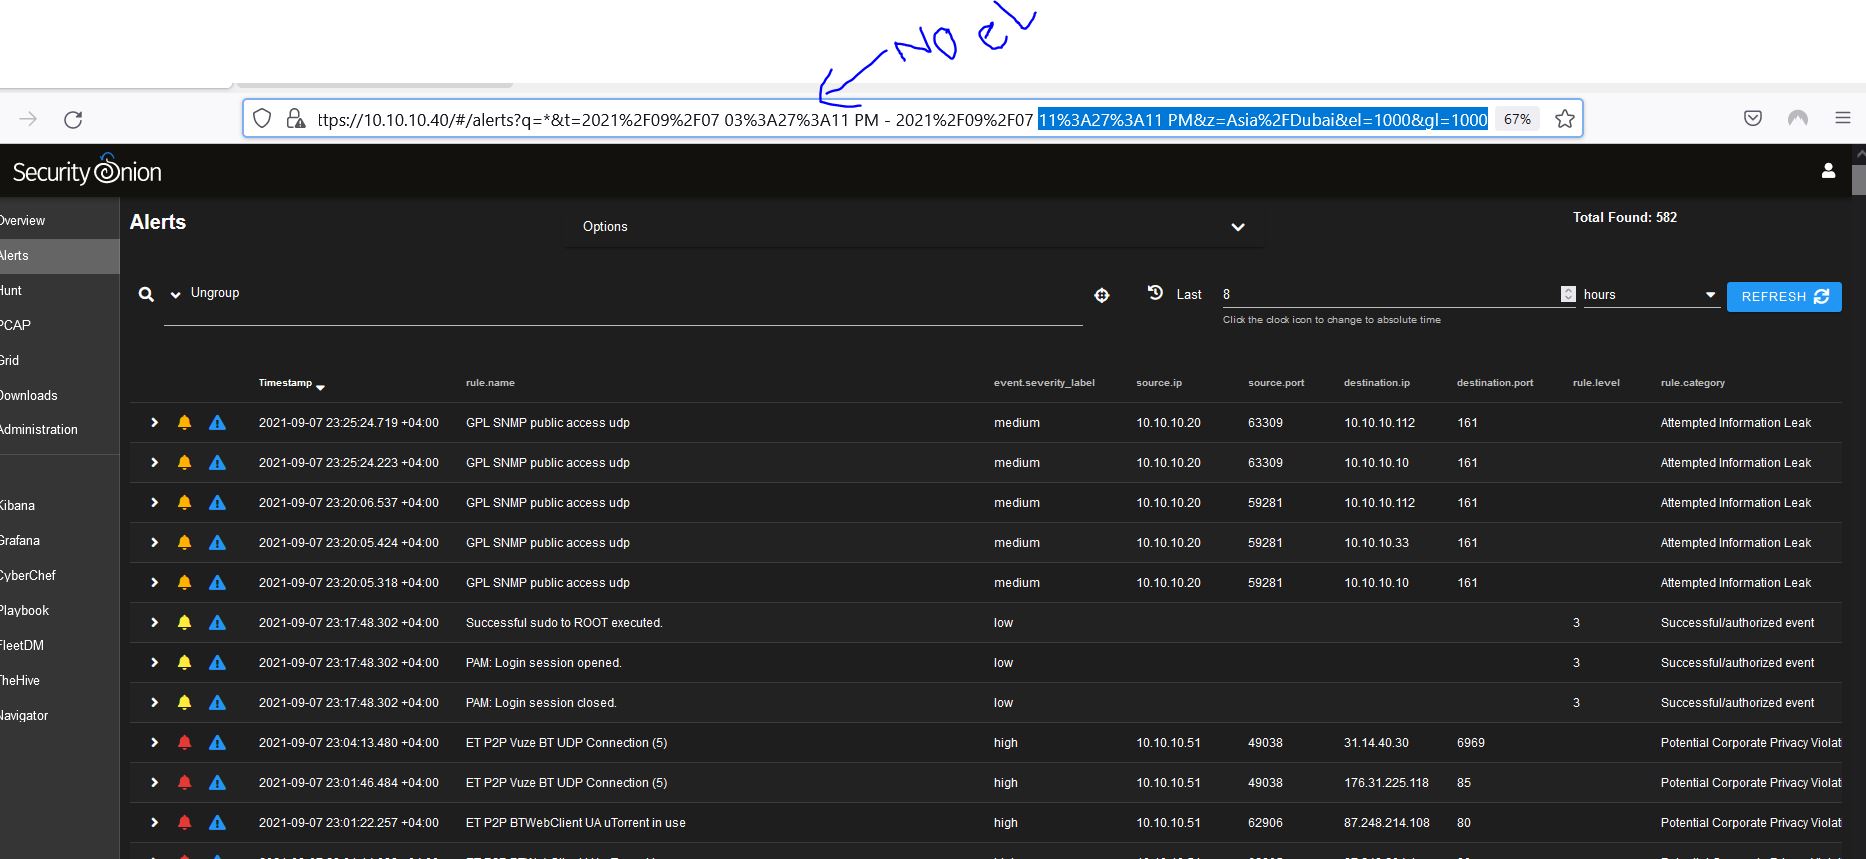
Hi Doug, Thanks for getting back to me, unfortunately in the URL I am not seeing any el see screenshot, again if you noticed between the two screenshot when I use 8 hours I am able to capture alerts for 8 hours to the current time, but when I extend this to 24 hours or above 8 hours it gives me a different result and I can only capture some alerts and it is also behind the my current time, thanks
|
Beta Was this translation helpful? Give feedback.
-
|
Looking at your screenshot, I see |
Beta Was this translation helpful? Give feedback.
-
|
Hi Doug, Thanks got it lol, I must be going blind, increasing the el now I see the most recent alert, thank you, something else I noticed is there a way to prevent security onion to time out to keep the alert screen active or is this base on the browser itself? it seems after a while it goes inactive not sure if this is to do with the ssl certificate or something else? |
Beta Was this translation helpful? Give feedback.
-
|
It seems we have answered this discussion about alerts. If you have other questions or problems, please start a separate discussion with appropriate title and provide detailed information there. |
Beta Was this translation helpful? Give feedback.
-
|
Thank you for all your help Dough, I will start a new discussion. |
Beta Was this translation helpful? Give feedback.
In the Ungrouped view, scroll all the way down to the bottom of the page and you should see a
Rows per pageselection. When you adjust this value, it should adjust theelparameter in the URL, so you can also change this manually in the URL.