Replies: 1 comment 5 replies
-
|
Are you able to share Grafana graphs from a 15 minute window around the 5 minute unresponsiveness (5 minutes before the unresponsiveness began and 5 minutes after it stopped)? Have you checked the logs in /opt/so/log/ for additional clues? |
Beta Was this translation helpful? Give feedback.
-
|
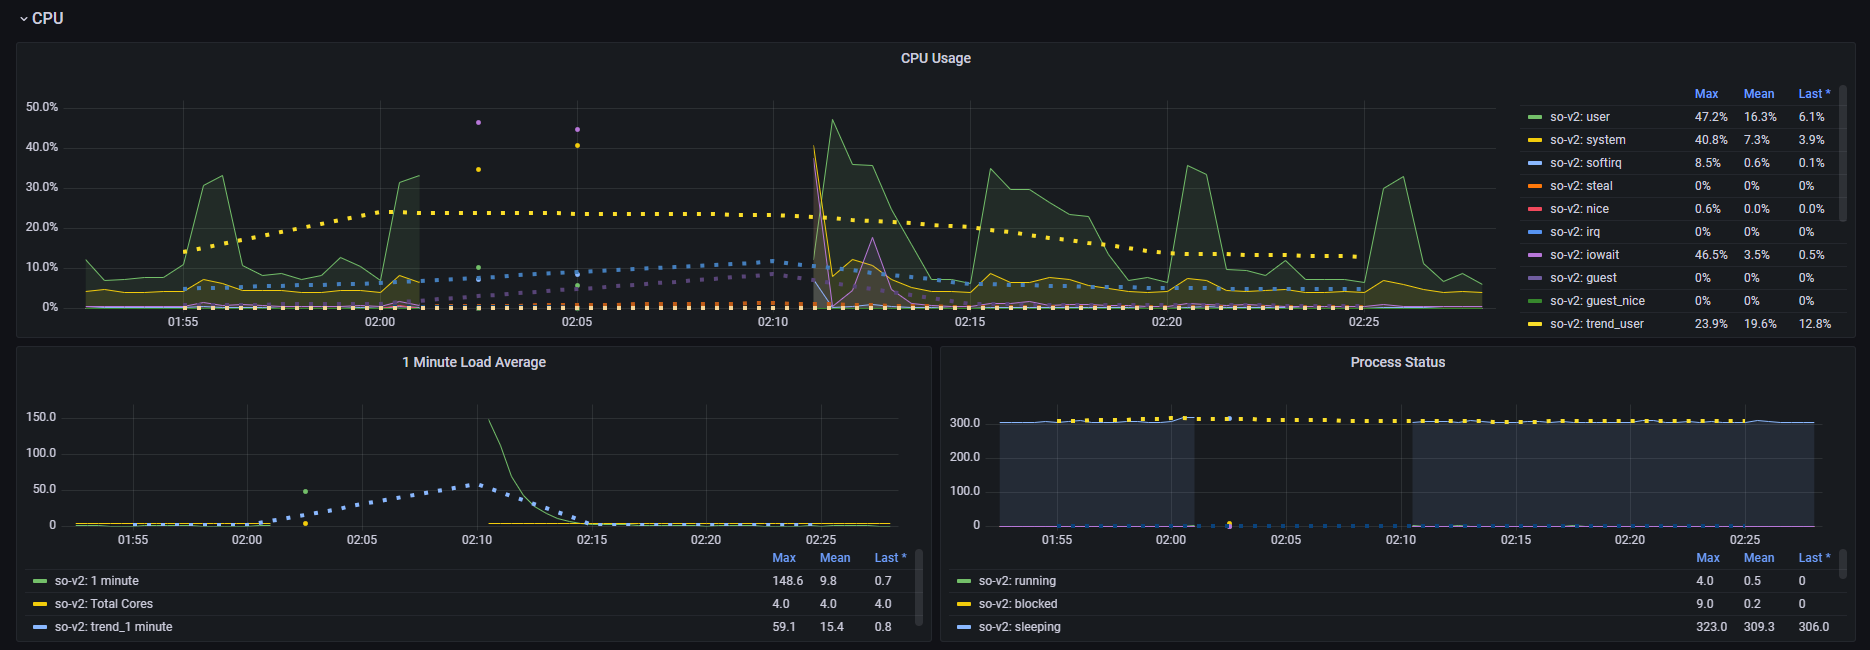
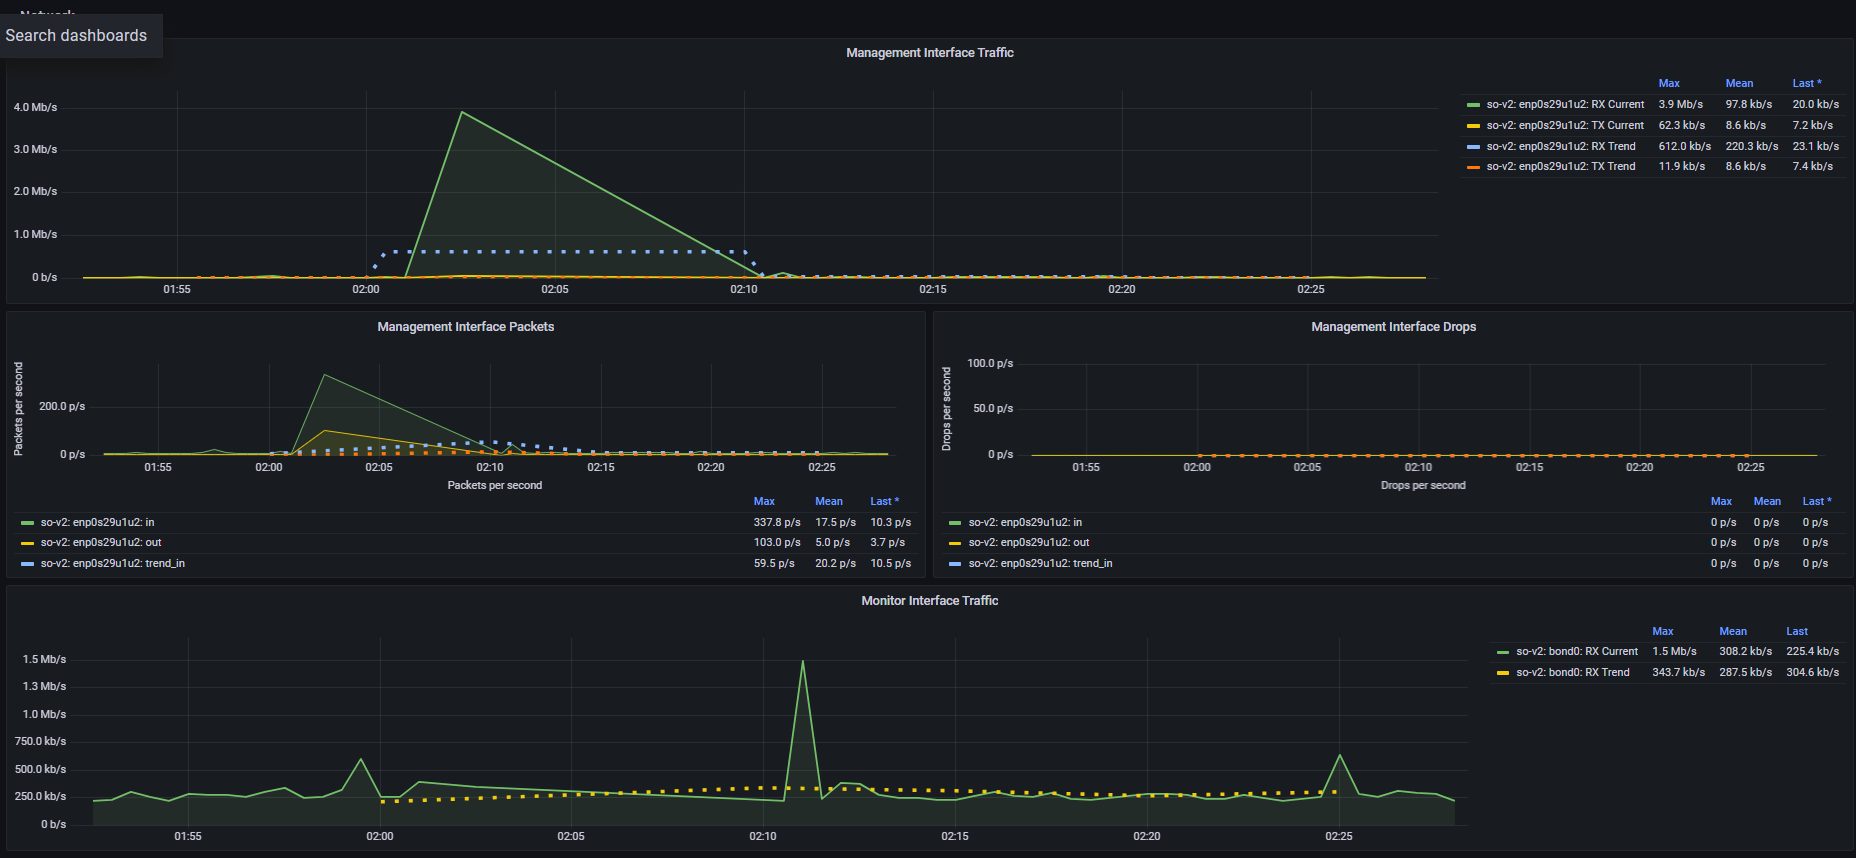
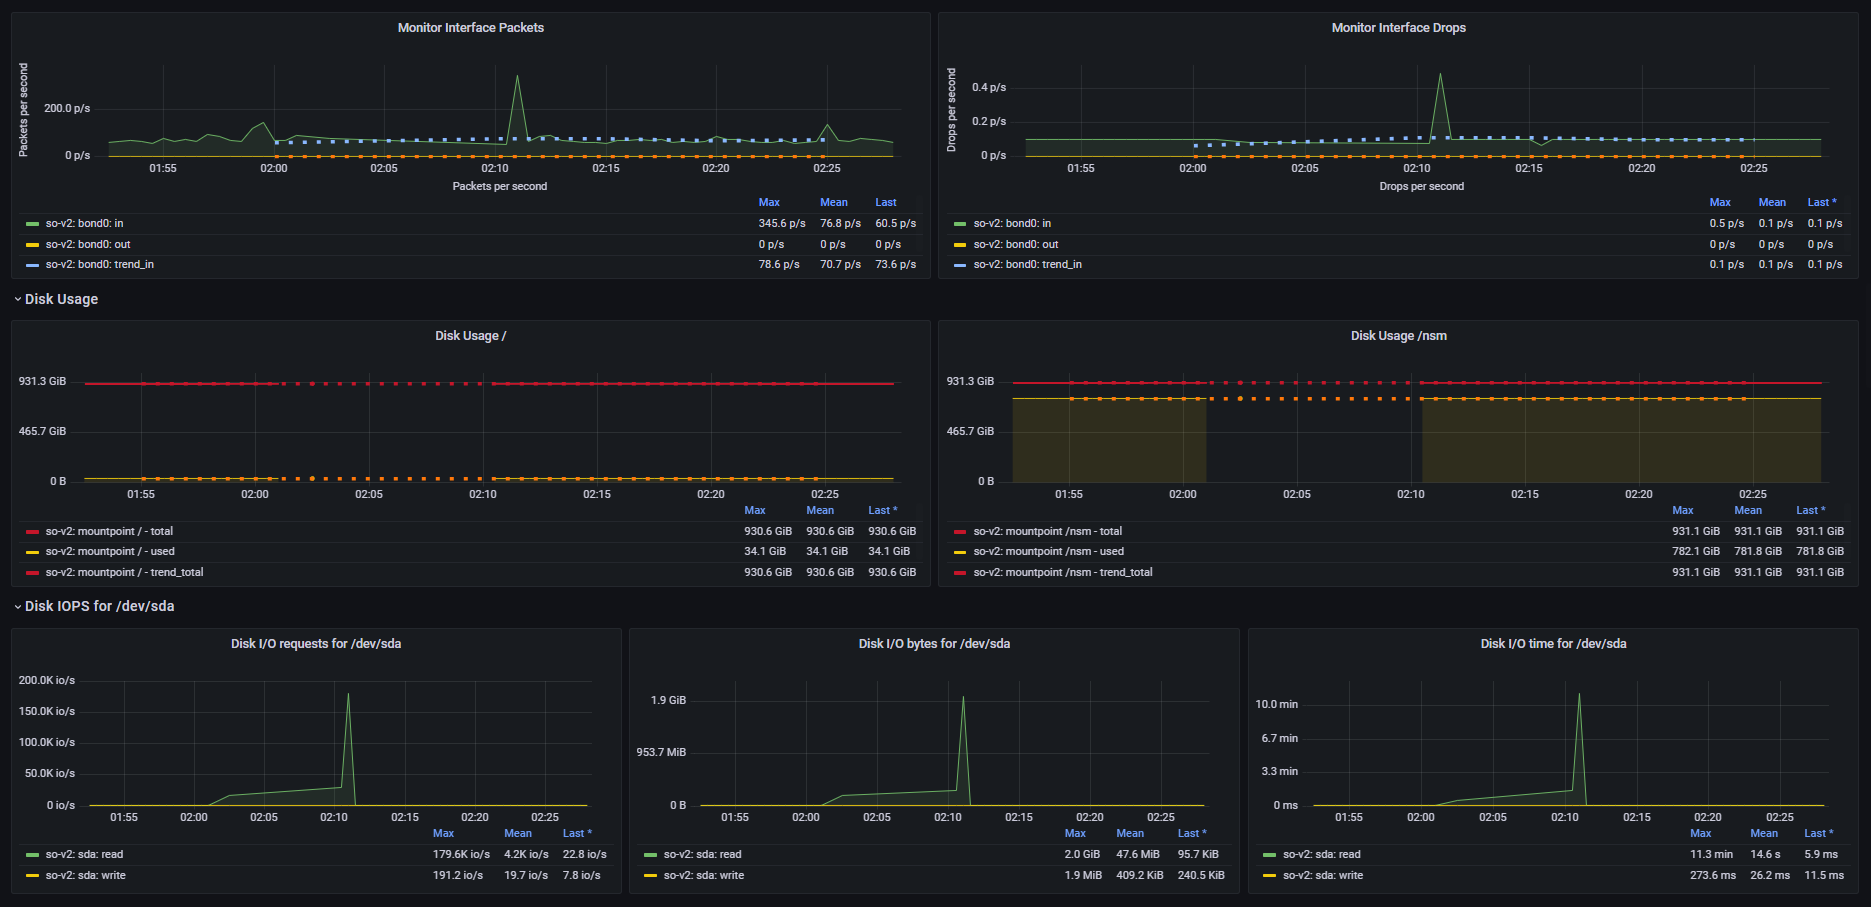
Here are some more graphs.
Happy to add any other graphs that would be useful. I'll start digging into the logs. Any suggestions on which you would search first as there are a bunch? Thanks! |
Beta Was this translation helpful? Give feedback.
-
|
Is this happening on a regular basis? Do you have playbook enabled? If so, do you have any |
Beta Was this translation helpful? Give feedback.
-
|
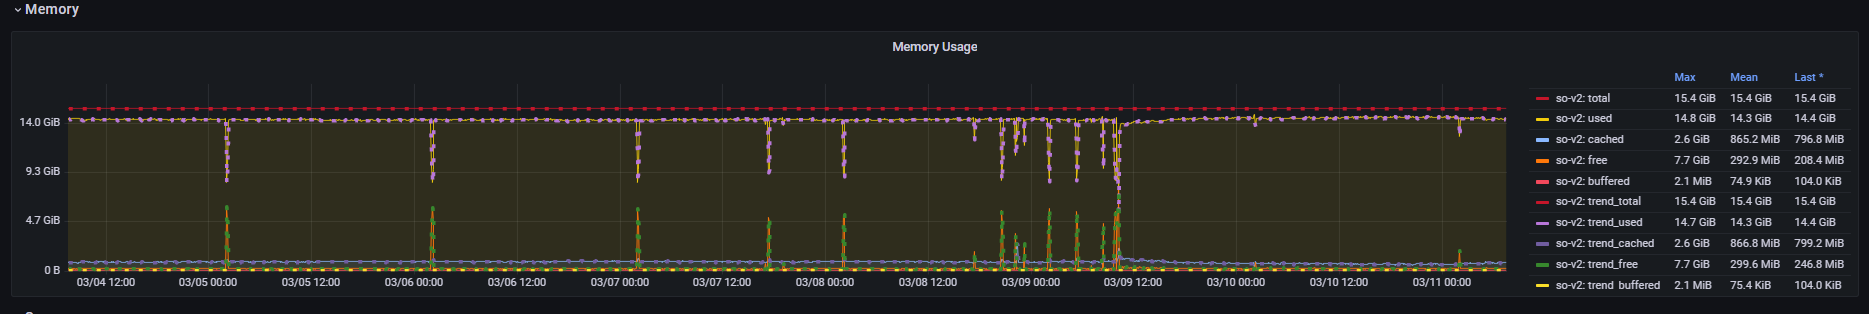
In general, it seems to regularly happen once I get over 7 days of uptime. Given I only have 16GB RAM (and run on average at 93% memory utilization) should I have swap enabled since my disks are SSD. I don't know if it becomes memory starved at certain moments, and then whatever is happening causes a cascading effect.
Looking at the Elasticsearch logs, I do see it throw a java error just before one of the spikes. I can grab more of any of the logs that may help.
Regards, |
Beta Was this translation helpful? Give feedback.
-
|
Yes, please try enabling swap. From https://docs.securityonion.net/en/2.3/hardware.html#standalone-deployments:
|
Beta Was this translation helpful? Give feedback.
-
|
Ok, I have created a 4GB Swapfile, and I'll monitor to see how it affects the system. |
Beta Was this translation helpful? Give feedback.
Uh oh!
There was an error while loading. Please reload this page.
-
Home Network (on-prem)
Intel i5 Processor (4 core)
Security Onion 2.3.100 Standard Install from ISO (then upgrade applied)
1 Node
CentOS 7 Install
16GB RAM (unfortunately the max the system can hold)
1TB SSD System Disk
2TB SSD /nsm (Only have 1TB partitioned currently as I copied my old 1TB spinning disk)
Avg 1.8Mb/s on Monitor Interface over 24 hours
Avg RAM usage (92%) over 24 hours
Avg CPU 22% over 24 hours
All services (so-status) green
The last time I posted (Playbook impact on performance #6837), I believe the issue was an IOWait issue of a failing system disk (which I replaced with an SSD).
After the system is up for over a week, I start getting times when the system interface is unresponsive for 5+ minutes, then returns to normal. Below is the Grafana dashboard. I'm trying to figure out what kicks off to cause this issue. I have verified that neither disk (both new) are showing any issues.
Any suggestions on what I should investigate would be appreciated.
Regards,
Scott
Beta Was this translation helpful? Give feedback.
All reactions