Services are up and running still Kibana is 404 page not found #9043
Replies: 1 comment 6 replies
-
|
From #1720:
|
Beta Was this translation helpful? Give feedback.
-
I don't see your version here.
I'm not sure I understand your answers here. If you used our Security Onion ISO image, then that should mean that you're NOT using Ubuntu.
I don't see your hardware specs here.
How did you configure your installation? EVAL or STANDALONE?
Are you able to duplicate this error on a fresh installation?
Have you checked logs in /opt/so/log/ for additional clues? |
Beta Was this translation helpful? Give feedback.
-
|
Thank you for follow up . Version of Security onion 2.3.181 SOUP - Security Onion UPdater Please review the following for more information about the update process and recent updates: Press Enter to continue or Ctrl-C to cancel. Preparing soup at Wed 09 Nov 2022 12:08:13 AM UTCChecking if we can talk to the salt master This is a manager, so we can proceed. The manager's pillars can be rendered. We can proceed with SOUP. Checking to see if this is an airgap install. Found that Security Onion 2.3.181 is currently installed. Cloning Security Onion github repo into /tmp/sogh/securityonion. Elastic License has already been accepted WARNING: apt does not have a stable CLI interface. Use with caution in scripts. Press U to update OS packages (recommended), C to continue without updates, or E to exit: We have detected missing operating system (OS) updates. Do you want to install these OS updates now? This could take a while depending on the size of your grid and how many packages are missing, but it is recommended to keep your system updated. u Results: retcode:
|
Beta Was this translation helpful? Give feedback.
-
|
I don't see answers to the following questions that I asked previously, so I'll ask again: What are the hardware specs of your machine? How did you configure your installation? EVAL or STANDALONE? Are you able to duplicate the salt un-handled exception on a fresh installation? Have you checked logs in /opt/so/log/ for additional clues? |
Beta Was this translation helpful? Give feedback.
-
|
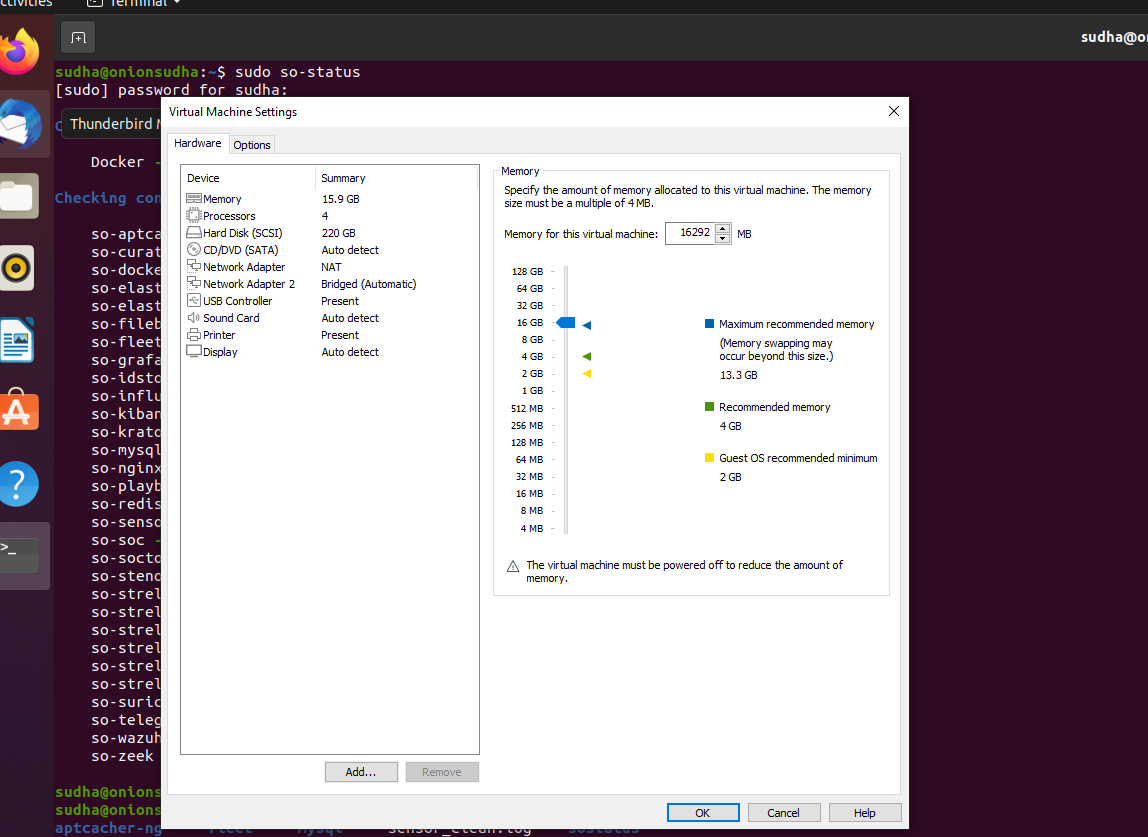
Hard ware specs are attached .
Installed security onion in VM through SO image. When i do sudo salt-call state.highstate I did not try for fresh installation ..I have been learning security onion since one month everything was pretty much working ! of late Kibana and hunt pages are available .. |
Beta Was this translation helpful? Give feedback.
-
|
Looking at your screenshot, there is a message that memory swapping may occur beyond 13.3GB but you've exceeded this and set it to 16GB. This is likely causing issues. You'll either need to increase RAM in the host machine or decrease RAM in the VM (perhaps scaling back to an IMPORT installation as shown at https://docs.securityonion.net/en/2.3/first-time-users.html). |
Beta Was this translation helpful? Give feedback.
Uh oh!
There was an error while loading. Please reload this page.
-
Hi,
Its been one month with security onion.
All of sudden Kibana is not found.
I did not make any configuration changes and Kibana dashboard was very well loading suddenly not sure about kibana not found issue made my work struck.
The following ground work made:-
First verified status of services.
sudo so-status -------------All services are green and okay.
then
sudo docker logs so-kibana
[2022-10-28T17:02:49.250+00:00][INFO ][node] Kibana process configured with roles: [background_tasks, ui]
[2022-10-28T17:03:02.209+00:00][INFO ][http.server.Preboot] http server running at http://0.0.0.0:5601
[2022-10-28T17:03:02.297+00:00][INFO ][plugins-system.preboot] Setting up [1] plugins: [interactiveSetup]
[2022-10-28T17:03:02.329+00:00][WARN ][config.deprecation] You should set server.basePath along with server.rewriteBasePath. Starting in 7.0, Kibana will expect that all requests start with server.basePath rather than expecting you to rewrite the requests in your reverse proxy. Set server.rewriteBasePath to false to preserve the current behavior and silence this warning.
[2022-10-28T17:03:02.329+00:00][WARN ][config.deprecation] The default mechanism for Reporting privileges will work differently in future versions, which will affect the behavior of this cluster. Set "xpack.reporting.roles.enabled" to "false" to adopt the future behavior before upgrading.
[2022-10-28T17:03:02.330+00:00][WARN ][config.deprecation] Setting "security.showInsecureClusterWarning" has been replaced by "xpack.security.showInsecureClusterWarning"
[2022-10-28T17:03:02.525+00:00][INFO ][plugins-system.standard] Setting up [121] plugins: [translations,monitoringCollection,licensing,globalSearch,globalSearchProviders,features,mapsEms,licenseApiGuard,usageCollection,taskManager,telemetryCollectionManager,telemetryCollectionXpack,kibanaUsageCollection,share,embeddable,uiActionsEnhanced,screenshotMode,banners,newsfeed,fieldFormats,expressions,dataViews,charts,esUiShared,customIntegrations,home,searchprofiler,painlessLab,grokdebugger,management,advancedSettings,spaces,security,lists,encryptedSavedObjects,cloud,snapshotRestore,screenshotting,telemetry,licenseManagement,eventLog,actions,console,bfetch,data,watcher,reporting,fileUpload,ingestPipelines,alerting,unifiedSearch,savedObjects,graph,savedObjectsTagging,savedObjectsManagement,presentationUtil,expressionShape,expressionRevealImage,expressionRepeatImage,expressionMetric,expressionImage,controls,eventAnnotation,dataViewFieldEditor,triggersActionsUi,transform,stackAlerts,ruleRegistry,discover,fleet,indexManagement,remoteClusters,crossClusterReplication,indexLifecycleManagement,cloudSecurityPosture,discoverEnhanced,aiops,visualizations,canvas,visTypeXy,visTypeVislib,visTypeVega,visTypeTimeseries,rollup,visTypeTimelion,visTypeTagcloud,visTypeTable,visTypeMetric,visTypeHeatmap,visTypeMarkdown,dashboard,dashboardEnhanced,expressionXY,expressionTagcloud,expressionPartitionVis,visTypePie,expressionMetricVis,expressionLegacyMetricVis,expressionHeatmap,expressionGauge,lens,osquery,maps,dataVisualizer,ml,cases,timelines,sessionView,kubernetesSecurity,securitySolution,visTypeGauge,sharedUX,observability,synthetics,infra,upgradeAssistant,monitoring,logstash,enterpriseSearch,apm,dataViewManagement]
[2022-10-28T17:03:02.540+00:00][INFO ][plugins.taskManager] TaskManager is identified by the Kibana UUID: 4224f424-22b0-4508-bed5-54ace6c7a377
[2022-10-28T17:03:02.606+00:00][WARN ][plugins.security.config] Using secure cookies, but SSL is not enabled inside Kibana. SSL must be configured outside of Kibana to function properly.
[2022-10-28T17:03:02.629+00:00][WARN ][plugins.security.config] Using secure cookies, but SSL is not enabled inside Kibana. SSL must be configured outside of Kibana to function properly.
[2022-10-28T17:03:02.635+00:00][INFO ][plugins.encryptedSavedObjects] Hashed 'xpack.encryptedSavedObjects.encryptionKey' for this instance: IyIOEUYgs5MKLHvd0RoZ+7db76GTnPZ4iKj65xtZbUY=
[2022-10-28T17:03:02.735+00:00][WARN ][plugins.reporting.config] Found 'server.host: "0.0.0.0"' in Kibana configuration. Reporting is not able to use this as the Kibana server hostname. To enable PNG/PDF Reporting to work, 'xpack.reporting.kibanaServer.hostname: localhost' is automatically set in the configuration. You can prevent this message by adding 'xpack.reporting.kibanaServer.hostname: localhost' in kibana.yml.
[2022-10-28T17:03:02.774+00:00][INFO ][plugins.ruleRegistry] Installing common resources shared between all indices
[2022-10-28T17:03:02.809+00:00][INFO ][plugins.cloudSecurityPosture] Registered task successfully [Task: cloud_security_posture-stats_task]
[2022-10-28T17:03:03.421+00:00][INFO ][plugins.screenshotting.config] Chromium sandbox provides an additional layer of protection, and is supported for Linux Ubuntu 20.04 OS. Automatically enabling Chromium sandbox.
[2022-10-28T17:03:04.036+00:00][INFO ][savedobjects-service] Waiting until all Elasticsearch nodes are compatible with Kibana before starting saved objects migrations...
[2022-10-28T17:03:04.037+00:00][INFO ][savedobjects-service] Starting saved objects migrations
[2022-10-28T17:03:04.094+00:00][INFO ][savedobjects-service] [.kibana_task_manager] INIT -> WAIT_FOR_YELLOW_SOURCE. took: 20ms.
[2022-10-28T17:03:04.098+00:00][INFO ][savedobjects-service] [.kibana] INIT -> WAIT_FOR_YELLOW_SOURCE. took: 27ms.
[2022-10-28T17:03:04.102+00:00][INFO ][savedobjects-service] [.kibana] WAIT_FOR_YELLOW_SOURCE -> CHECK_UNKNOWN_DOCUMENTS. took: 4ms.
[2022-10-28T17:03:04.525+00:00][INFO ][savedobjects-service] [.kibana] CHECK_UNKNOWN_DOCUMENTS -> SET_SOURCE_WRITE_BLOCK. took: 422ms.
[2022-10-28T17:03:04.566+00:00][INFO ][savedobjects-service] [.kibana] SET_SOURCE_WRITE_BLOCK -> CALCULATE_EXCLUDE_FILTERS. took: 42ms.
[2022-10-28T17:03:04.629+00:00][ERROR][savedobjects-service] [.kibana] Action failed with 'search_phase_execution_exception: [no_shard_available_action_exception] Reason: null'. Retrying attempt 1 in 2 seconds.
[2022-10-28T17:03:04.631+00:00][INFO ][savedobjects-service] [.kibana] CALCULATE_EXCLUDE_FILTERS -> CALCULATE_EXCLUDE_FILTERS. took: 63ms.
[2022-10-28T17:03:04.813+00:00][INFO ][plugins.screenshotting.chromium] Browser executable: /usr/share/kibana/x-pack/plugins/screenshotting/chromium/headless_shell-linux_x64/headless_shell
[2022-10-28T17:03:06.644+00:00][ERROR][savedobjects-service] [.kibana] Action failed with 'search_phase_execution_exception: [no_shard_available_action_exception] Reason: null'. Retrying attempt 2 in 4 seconds.
[2022-10-28T17:03:06.644+00:00][INFO ][savedobjects-service] [.kibana] CALCULATE_EXCLUDE_FILTERS -> CALCULATE_EXCLUDE_FILTERS. took: 2015ms.
[2022-10-28T17:03:10.655+00:00][ERROR][savedobjects-service] [.kibana] Action failed with 'search_phase_execution_exception: [no_shard_available_action_exception] Reason: null'. Retrying attempt 3 in 8 seconds.
[2022-10-28T17:03:10.655+00:00][INFO ][savedobjects-service] [.kibana] CALCULATE_EXCLUDE_FILTERS -> CALCULATE_EXCLUDE_FILTERS. took: 4011ms.
[2022-10-28T17:03:18.667+00:00][ERROR][savedobjects-service] [.kibana] Action failed with 'search_phase_execution_exception: [no_shard_available_action_exception] Reason: null'. Retrying attempt 4 in 16 seconds.
[2022-10-28T17:03:18.667+00:00][INFO ][savedobjects-service] [.kibana] CALCULATE_EXCLUDE_FILTERS -> CALCULATE_EXCLUDE_FILTERS. took: 8012ms.
[2022-10-28T17:03:34.682+00:00][ERROR][savedobjects-service] [.kibana] Action failed with 'search_phase_execution_exception: [no_shard_available_action_exception] Reason: null'. Retrying attempt 5 in 32 seconds.
[2022-10-28T17:03:34.689+00:00][INFO ][savedobjects-service] [.kibana] CALCULATE_EXCLUDE_FILTERS -> CALCULATE_EXCLUDE_FILTERS. took: 16015ms.
[2022-10-28T17:04:04.100+00:00][ERROR][savedobjects-service] [.kibana_task_manager] Action failed with '[index_not_yellow_timeout] Timeout waiting for the status of the [.kibana_task_manager_8.3.3_001] index to become 'yellow' Refer to https://www.elastic.co/guide/en/kibana/8.4/resolve-migrations-failures.html#_repeated_time_out_requests_that_eventually_fail for information on how to resolve the issue.'. Retrying attempt 1 in 2 seconds.
[2022-10-28T17:04:04.100+00:00][INFO ][savedobjects-service] [.kibana_task_manager] WAIT_FOR_YELLOW_SOURCE -> WAIT_FOR_YELLOW_SOURCE. took: 60006ms.
[2022-10-28T17:04:06.701+00:00][ERROR][savedobjects-service] [.kibana] Action failed with 'search_phase_execution_exception: [no_shard_available_action_exception] Reason: null'. Retrying attempt 6 in 64 seconds.
[2022-10-28T17:04:06.702+00:00][INFO ][savedobjects-service] [.kibana] CALCULATE_EXCLUDE_FILTERS -> CALCULATE_EXCLUDE_FILTERS. took: 32019ms.
[2022-10-28T17:05:06.105+00:00][ERROR][savedobjects-service] [.kibana_task_manager] Action failed with '[index_not_yellow_timeout] Timeout waiting for the status of the [.kibana_task_manager_8.3.3_001] index to become 'yellow' Refer to https://www.elastic.co/guide/en/kibana/8.4/resolve-migrations-failures.html#_repeated_time_out_requests_that_eventually_fail for information on how to resolve the issue.'. Retrying attempt 2 in 4 seconds.
[2022-10-28T17:05:06.106+00:00][INFO ][savedobjects-service] [.kibana_task_manager] WAIT_FOR_YELLOW_SOURCE -> WAIT_FOR_YELLOW_SOURCE. took: 62005ms.
[2022-10-28T17:05:10.725+00:00][ERROR][savedobjects-service] [.kibana] Action failed with 'search_phase_execution_exception: [no_shard_available_action_exception] Reason: null'. Retrying attempt 7 in 64 seconds.
[2022-10-28T17:05:10.726+00:00][INFO ][savedobjects-service] [.kibana] CALCULATE_EXCLUDE_FILTERS -> CALCULATE_EXCLUDE_FILTERS. took: 64024ms.
[2022-10-28T17:06:10.109+00:00][ERROR][savedobjects-service] [.kibana_task_manager] Action failed with '[index_not_yellow_timeout] Timeout waiting for the status of the [.kibana_task_manager_8.3.3_001] index to become 'yellow' Refer to https://www.elastic.co/guide/en/kibana/8.4/resolve-migrations-failures.html#_repeated_time_out_requests_that_eventually_fail for information on how to resolve the issue.'. Retrying attempt 3 in 8 seconds.
[2022-10-28T17:06:10.110+00:00][INFO ][savedobjects-service] [.kibana_task_manager] WAIT_FOR_YELLOW_SOURCE -> WAIT_FOR_YELLOW_SOURCE. took: 64004ms.
[2022-10-28T17:06:14.743+00:00][ERROR][savedobjects-service] [.kibana] Action failed with 'search_phase_execution_exception: [no_shard_available_action_exception] Reason: null'. Retrying attempt 8 in 64 seconds.
[2022-10-28T17:06:14.743+00:00][INFO ][savedobjects-service] [.kibana] CALCULATE_EXCLUDE_FILTERS -> CALCULATE_EXCLUDE_FILTERS. took: 64018ms.
[2022-10-28T17:07:18.114+00:00][ERROR][savedobjects-service] [.kibana_task_manager] Action failed with '[index_not_yellow_timeout] Timeout waiting for the status of the [.kibana_task_manager_8.3.3_001] index to become 'yellow' Refer to https://www.elastic.co/guide/en/kibana/8.4/resolve-migrations-failures.html#_repeated_time_out_requests_that_eventually_fail for information on how to resolve the issue.'. Retrying attempt 4 in 16 seconds.
[2022-10-28T17:07:18.114+00:00][INFO ][savedobjects-service] [.kibana_task_manager] WAIT_FOR_YELLOW_SOURCE -> WAIT_FOR_YELLOW_SOURCE. took: 68005ms.
[2022-10-28T17:07:18.754+00:00][ERROR][savedobjects-service] [.kibana] Action failed with 'search_phase_execution_exception: [no_shard_available_action_exception] Reason: null'. Retrying attempt 9 in 64 seconds.
[2022-10-28T17:07:18.754+00:00][INFO ][savedobjects-service] [.kibana] CALCULATE_EXCLUDE_FILTERS -> CALCULATE_EXCLUDE_FILTERS. took: 64011ms.
[2022-10-28T17:15:04.671+00:00][INFO ][savedobjects-service] [.kibana_task_manager] WAIT_FOR_YELLOW_SOURCE -> WAIT_FOR_YELLOW_SOURCE. took: 62014ms.
[2022-10-28T17:15:09.480+00:00][ERROR][savedobjects-service] [.kibana] Action failed with 'search_phase_execution_exception: [no_shard_available_action_exception] Reason: null'. Retrying attempt 7 in 64 seconds.
[2022-10-28T17:15:09.480+00:00][INFO ][savedobjects-service] [.kibana] CALCULATE_EXCLUDE_FILTERS -> CALCULATE_EXCLUDE_FILTERS. took: 64221ms.
[2022-10-28T17:16:08.678+00:00][ERROR][savedobjects-service] [.kibana_task_manager] Action failed with '[index_not_yellow_timeout] Timeout waiting for the status of the [.kibana_task_manager_8.3.3_001] index to become 'yellow' Refer to https://www.elastic.co/guide/en/kibana/8.4/resolve-migrations-failures.html#_repeated_time_out_requests_that_eventually_fail for information on how to resolve the issue.'. Retrying attempt 3 in 8 seconds.
[2022-10-28T17:16:08.678+00:00][INFO ][savedobjects-service] [.kibana_task_manager] WAIT_FOR_YELLOW_SOURCE -> WAIT_FOR_YELLOW_SOURCE. took: 64006ms.
[2022-10-28T17:16:13.499+00:00][ERROR][savedobjects-service] [.kibana] Action failed with 'search_phase_execution_exception: [no_shard_available_action_exception] Reason: null'. Retrying attempt 8 in 64 seconds.
[2022-10-28T17:16:13.499+00:00][INFO ][savedobjects-service] [.kibana] CALCULATE_EXCLUDE_FILTERS -> CALCULATE_EXCLUDE_FILTERS. took: 64019ms.
[2022-10-28T17:17:16.681+00:00][ERROR][savedobjects-service] [.kibana_task_manager] Action failed with '[index_not_yellow_timeout] Timeout waiting for the status of the [.kibana_task_manager_8.3.3_001] index to become 'yellow' Refer to https://www.elastic.co/guide/en/kibana/8.4/resolve-migrations-failures.html#_repeated_time_out_requests_that_eventually_fail for information on how to resolve the issue.'. Retrying attempt 4 in 16 seconds.
[2022-10-28T17:17:16.682+00:00][INFO ][savedobjects-service] [.kibana_task_manager] WAIT_FOR_YELLOW_SOURCE -> WAIT_FOR_YELLOW_SOURCE. took: 68004ms.
[2022-10-28T17:17:17.510+00:00][ERROR][savedobjects-service] [.kibana] Action failed with 'search_phase_execution_exception: [no_shard_available_action_exception] Reason: null'. Retrying attempt 9 in 64 seconds.
[2022-10-28T17:17:17.510+00:00][INFO ][savedobjects-service] [.kibana] CALCULATE_EXCLUDE_FILTERS -> CALCULATE_EXCLUDE_FILTERS. took: 64011ms.
[2022-10-28T17:18:21.522+00:00][ERROR][savedobjects-service] [.kibana] Action failed with 'search_phase_execution_exception: [no_shard_available_action_exception] Reason: null'. Retrying attempt 10 in 64 seconds.
[2022-10-28T17:18:21.522+00:00][INFO ][savedobjects-service] [.kibana] CALCULATE_EXCLUDE_FILTERS -> CALCULATE_EXCLUDE_FILTERS. took: 64012ms.
[2022-10-28T17:18:32.691+00:00][ERROR][savedobjects-service] [.kibana_task_manager] Action failed with '[index_not_yellow_timeout] Timeout waiting for the status of the [.kibana_task_manager_8.3.3_001] index to become 'yellow' Refer to https://www.elastic.co/guide/en/kibana/8.4/resolve-migrations-failures.html#_repeated_time_out_requests_that_eventually_fail for information on how to resolve the issue.'. Retrying attempt 5 in 32 seconds.
[2022-10-28T17:18:32.691+00:00][INFO ][savedobjects-service] [.kibana_task_manager] WAIT_FOR_YELLOW_SOURCE -> WAIT_FOR_YELLOW_SOURCE. took: 76010ms.
[2022-10-28T17:19:25.533+00:00][ERROR][savedobjects-service] [.kibana] Action failed with 'search_phase_execution_exception: [no_shard_available_action_exception] Reason: null'. Retrying attempt 11 in 64 seconds.
[2022-10-28T17:19:25.534+00:00][INFO ][savedobjects-service] [.kibana] CALCULATE_EXCLUDE_FILTERS -> CALCULATE_EXCLUDE_FILTERS. took: 64011ms.
[2022-10-28T17:20:04.700+00:00][ERROR][savedobjects-service] [.kibana_task_manager] Action failed with '[index_not_yellow_timeout] Timeout waiting for the status of the [.kibana_task_manager_8.3.3_001] index to become 'yellow' Refer to https://www.elastic.co/guide/en/kibana/8.4/resolve-migrations-failures.html#_repeated_time_out_requests_that_eventually_fail for information on how to resolve the issue.'. Retrying attempt 6 in 64 seconds.
[2022-10-28T17:20:04.700+00:00][INFO ][savedobjects-service] [.kibana_task_manager] WAIT_FOR_YELLOW_SOURCE -> WAIT_FOR_YELLOW_SOURCE. took: 92009ms.
[2022-10-28T17:20:29.544+00:00][ERROR][savedobjects-service] [.kibana] Action failed with 'search_phase_execution_exception: [no_shard_available_action_exception] Reason: null'. Retrying attempt 12 in 64 seconds.
[2022-10-28T17:20:29.544+00:00][INFO ][savedobjects-service] [.kibana] CALCULATE_EXCLUDE_FILTERS -> CALCULATE_EXCLUDE_FILTERS. took: 64011ms.
[2022-10-28T17:21:33.557+00:00][ERROR][savedobjects-service] [.kibana] Action failed with 'search_phase_execution_exception: [no_shard_available_action_exception] Reason: null'. Retrying attempt 13 in 64 seconds.
[2022-10-28T17:21:33.557+00:00][INFO ][savedobjects-service] [.kibana] CALCULATE_EXCLUDE_FILTERS -> CALCULATE_EXCLUDE_FILTERS. took: 64013ms.
[2022-10-28T17:22:08.709+00:00][ERROR][savedobjects-service] [.kibana_task_manager] Action failed with '[index_not_yellow_timeout] Timeout waiting for the status of the [.kibana_task_manager_8.3.3_001] index to become 'yellow' Refer to https://www.elastic.co/guide/en/kibana/8.4/resolve-migrations-failures.html#_repeated_time_out_requests_that_eventually_fail for information on how to resolve the issue.'. Retrying attempt 7 in 64 seconds.
[2022-10-28T17:22:08.710+00:00][INFO ][savedobjects-service] [.kibana_task_manager] WAIT_FOR_YELLOW_SOURCE -> WAIT_FOR_YELLOW_SOURCE. took: 124009ms.
[2022-10-28T17:22:37.569+00:00][ERROR][savedobjects-service] [.kibana] Action failed with 'search_phase_execution_exception: [no_shard_available_action_exception] Reason: null'. Retrying attempt 14 in 64 seconds.
[2022-10-28T17:22:37.570+00:00][INFO ][savedobjects-service] [.kibana] CALCULATE_EXCLUDE_FILTERS -> CALCULATE_EXCLUDE_FILTERS. took: 64012ms.
[2022-10-28T17:23:41.580+00:00][ERROR][savedobjects-service] [.kibana] Action failed with 'search_phase_execution_exception: [no_shard_available_action_exception] Reason: null'. Retrying attempt 15 in 64 seconds.
[2022-10-28T17:23:41.580+00:00][INFO ][savedobjects-service] [.kibana] CALCULATE_EXCLUDE_FILTERS -> CALCULATE_EXCLUDE_FILTERS. took: 64011ms.
[2022-10-28T17:24:12.714+00:00][ERROR][savedobjects-service] [.kibana_task_manager] Action failed with '[index_not_yellow_timeout] Timeout waiting for the status of the [.kibana_task_manager_8.3.3_001] index to become 'yellow' Refer to https://www.elastic.co/guide/en/kibana/8.4/resolve-migrations-failures.html#_repeated_time_out_requests_that_eventually_fail for information on how to resolve the issue.'. Retrying attempt 8 in 64 seconds.
[2022-10-28T17:24:12.715+00:00][INFO ][savedobjects-service] [.kibana_task_manager] WAIT_FOR_YELLOW_SOURCE -> WAIT_FOR_YELLOW_SOURCE. took: 124005ms.
[2022-10-28T17:24:45.589+00:00][INFO ][savedobjects-service] [.kibana] CALCULATE_EXCLUDE_FILTERS -> FATAL. took: 64009ms.
[2022-10-28T17:24:45.592+00:00][FATAL][root] Error: Unable to complete saved object migrations for the [.kibana] index: Unable to complete the CALCULATE_EXCLUDE_FILTERS step after 15 attempts, terminating. The last failure message was: search_phase_execution_exception: [no_shard_available_action_exception] Reason: null
at migrationStateActionMachine (/usr/share/kibana/src/core/server/saved_objects/migrations/migrations_state_action_machine.js:144:29)
at processTicksAndRejections (node:internal/process/task_queues:96:5)
at async Promise.all (index 0)
at SavedObjectsService.start (/usr/share/kibana/src/core/server/saved_objects/saved_objects_service.js:214:9)
at Server.start (/usr/share/kibana/src/core/server/server.js:369:31)
at Root.start (/usr/share/kibana/src/core/server/root/index.js:69:14)
at bootstrap (/usr/share/kibana/src/core/server/bootstrap.js:120:5)
at Command. (/usr/share/kibana/src/cli/serve/serve.js:216:5)
[2022-10-28T17:24:45.628+00:00][INFO ][plugins-system.preboot] Stopping all plugins.
[2022-10-28T17:24:45.631+00:00][INFO ][plugins-system.standard] Stopping all plugins.
[2022-10-28T17:24:45.632+00:00][INFO ][plugins.monitoring.monitoring.kibana-monitoring] Monitoring stats collection is stopped
[2022-10-28T17:24:45.636+00:00][ERROR][plugins.ruleRegistry] Error: Server is stopping; must stop all async operations
at /usr/share/kibana/x-pack/plugins/rule_registry/server/rule_data_plugin_service/resource_installer.js:66:20
at processTicksAndRejections (node:internal/process/task_queues:96:5)
[2022-10-28T17:24:45.641+00:00][ERROR][plugins.ruleRegistry] Error: Failure installing common resources shared between all indices. Server is stopping; must stop all async operations
at ResourceInstaller.installWithTimeout (/usr/share/kibana/x-pack/plugins/rule_registry/server/rule_data_plugin_service/resource_installer.js:75:13)
at processTicksAndRejections (node:internal/process/task_queues:96:5)
at ResourceInstaller.installCommonResources (/usr/share/kibana/x-pack/plugins/rule_registry/server/rule_data_plugin_service/resource_installer.js:89:5)
FATAL Error: Unable to complete saved object migrations for the [.kibana] index: Unable to complete the CALCULATE_EXCLUDE_FILTERS step after 15 attempts, terminating. The last failure message was: search_phase_execution_exception: [no_shard_available_action_exception] Reason: null
[2022-10-31T15:51:12.861+00:00][INFO ][node] Kibana process configured with roles: [background_tasks, ui]
[2022-10-31T15:51:31.829+00:00][INFO ][http.server.Preboot] http server running at http://0.0.0.0:5601
[2022-10-31T15:51:31.955+00:00][INFO ][plugins-system.preboot] Setting up [1] plugins: [interactiveSetup]
[2022-10-31T15:51:32.015+00:00][WARN ][config.deprecation] You should set server.basePath along with server.rewriteBasePath. Starting in 7.0, Kibana will expect that all requests start with server.basePath rather than expecting you to rewrite the requests in your reverse proxy. Set server.rewriteBasePath to false to preserve the current behavior and silence this warning.
[2022-10-31T15:51:32.015+00:00][WARN ][config.deprecation] The default mechanism for Reporting privileges will work differently in future versions, which will affect the behavior of this cluster. Set "xpack.reporting.roles.enabled" to "false" to adopt the future behavior before upgrading.
[2022-10-31T15:51:32.016+00:00][WARN ][config.deprecation] Setting "security.showInsecureClusterWarning" has been replaced by "xpack.security.showInsecureClusterWarning"
[2022-10-31T15:51:32.336+00:00][INFO ][plugins-system.standard] Setting up [121] plugins: [translations,monitoringCollection,licensing,globalSearch,globalSearchProviders,features,mapsEms,licenseApiGuard,usageCollection,taskManager,telemetryCollectionManager,telemetryCollectionXpack,kibanaUsageCollection,share,embeddable,uiActionsEnhanced,screenshotMode,banners,newsfeed,fieldFormats,expressions,dataViews,charts,esUiShared,customIntegrations,home,searchprofiler,painlessLab,grokdebugger,management,advancedSettings,spaces,security,lists,encryptedSavedObjects,cloud,snapshotRestore,screenshotting,telemetry,licenseManagement,eventLog,actions,console,bfetch,data,watcher,reporting,fileUpload,ingestPipelines,alerting,unifiedSearch,savedObjects,graph,savedObjectsTagging,savedObjectsManagement,presentationUtil,expressionShape,expressionRevealImage,expressionRepeatImage,expressionMetric,expressionImage,controls,eventAnnotation,dataViewFieldEditor,triggersActionsUi,transform,stackAlerts,ruleRegistry,discover,fleet,indexManagement,remoteClusters,crossClusterReplication,indexLifecycleManagement,cloudSecurityPosture,discoverEnhanced,aiops,visualizations,canvas,visTypeXy,visTypeVislib,visTypeVega,visTypeTimeseries,rollup,visTypeTimelion,visTypeTagcloud,visTypeTable,visTypeMetric,visTypeHeatmap,visTypeMarkdown,dashboard,dashboardEnhanced,expressionXY,expressionTagcloud,expressionPartitionVis,visTypePie,expressionMetricVis,expressionLegacyMetricVis,expressionHeatmap,expressionGauge,lens,osquery,maps,dataVisualizer,ml,cases,timelines,sessionView,kubernetesSecurity,securitySolution,visTypeGauge,sharedUX,observability,synthetics,infra,upgradeAssistant,monitoring,logstash,enterpriseSearch,apm,dataViewManagement]
[2022-10-31T15:51:32.395+00:00][INFO ][plugins.taskManager] TaskManager is identified by the Kibana UUID: 4224f424-22b0-4508-bed5-54ace6c7a377
[2022-10-31T15:51:32.612+00:00][WARN ][plugins.security.config] Using secure cookies, but SSL is not enabled inside Kibana. SSL must be configured outside of Kibana to function properly.
[2022-10-31T15:51:32.645+00:00][WARN ][plugins.security.config] Using secure cookies, but SSL is not enabled inside Kibana. SSL must be configured outside of Kibana to function properly.
[2022-10-31T15:51:32.651+00:00][INFO ][plugins.encryptedSavedObjects] Hashed 'xpack.encryptedSavedObjects.encryptionKey' for this instance: IyIOEUYgs5MKLHvd0RoZ+7db76GTnPZ4iKj65xtZbUY=
[2022-10-31T15:51:32.790+00:00][WARN ][plugins.reporting.config] Found 'server.host: "0.0.0.0"' in Kibana configuration. Reporting is not able to use this as the Kibana server hostname. To enable PNG/PDF Reporting to work, 'xpack.reporting.kibanaServer.hostname: localhost' is automatically set in the configuration. You can prevent this message by adding 'xpack.reporting.kibanaServer.hostname: localhost' in kibana.yml.
[2022-10-31T15:51:32.853+00:00][INFO ][plugins.ruleRegistry] Installing common resources shared between all indices
[2022-10-31T15:51:32.973+00:00][INFO ][plugins.cloudSecurityPosture] Registered task successfully [Task: cloud_security_posture-stats_task]
[2022-10-31T15:51:34.216+00:00][INFO ][plugins.screenshotting.config] Chromium sandbox provides an additional layer of protection, and is supported for Linux Ubuntu 20.04 OS. Automatically enabling Chromium sandbox.
[2022-10-31T15:51:35.559+00:00][INFO ][savedobjects-service] Waiting until all Elasticsearch nodes are compatible with Kibana before starting saved objects migrations...
[2022-10-31T15:51:35.560+00:00][INFO ][savedobjects-service] Starting saved objects migrations
[2022-10-31T15:51:36.104+00:00][INFO ][savedobjects-service] [.kibana] INIT -> WAIT_FOR_YELLOW_SOURCE. took: 380ms.
[2022-10-31T15:51:36.114+00:00][INFO ][savedobjects-service] [.kibana_task_manager] INIT -> WAIT_FOR_YELLOW_SOURCE. took: 349ms.
[2022-10-31T15:51:36.122+00:00][INFO ][savedobjects-service] [.kibana] WAIT_FOR_YELLOW_SOURCE -> CHECK_UNKNOWN_DOCUMENTS. took: 19ms.
[2022-10-31T15:51:36.487+00:00][INFO ][savedobjects-service] [.kibana] CHECK_UNKNOWN_DOCUMENTS -> SET_SOURCE_WRITE_BLOCK. took: 365ms.
[2022-10-31T15:51:36.544+00:00][INFO ][savedobjects-service] [.kibana] SET_SOURCE_WRITE_BLOCK -> CALCULATE_EXCLUDE_FILTERS. took: 57ms.
[2022-10-31T15:51:36.646+00:00][ERROR][savedobjects-service] [.kibana] Action failed with 'search_phase_execution_exception: [no_shard_available_action_exception] Reason: null'. Retrying attempt 1 in 2 seconds.
[2022-10-31T15:51:36.646+00:00][INFO ][savedobjects-service] [.kibana] CALCULATE_EXCLUDE_FILTERS -> CALCULATE_EXCLUDE_FILTERS. took: 102ms.
[2022-10-31T15:51:38.693+00:00][ERROR][savedobjects-service] [.kibana] Action failed with 'search_phase_execution_exception: [no_shard_available_action_exception] Reason: null'. Retrying attempt 2 in 4 seconds.
[2022-10-31T15:51:38.693+00:00][INFO ][savedobjects-service] [.kibana] CALCULATE_EXCLUDE_FILTERS -> CALCULATE_EXCLUDE_FILTERS. took: 2047ms.
[2022-10-31T15:51:42.770+00:00][ERROR][savedobjects-service] [.kibana] Action failed with 'search_phase_execution_exception: [no_shard_available_action_exception] Reason: null'. Retrying attempt 3 in 8 seconds.
[2022-10-31T15:51:42.771+00:00][INFO ][savedobjects-service] [.kibana] CALCULATE_EXCLUDE_FILTERS -> CALCULATE_EXCLUDE_FILTERS. took: 4077ms.
[2022-10-31T15:51:43.274+00:00][INFO ][plugins.screenshotting.chromium] Browser executable: /usr/share/kibana/x-pack/plugins/screenshotting/chromium/headless_shell-linux_x64/headless_shell
[2022-10-31T15:51:50.848+00:00][ERROR][savedobjects-service] [.kibana] Action failed with 'search_phase_execution_exception: [no_shard_available_action_exception] Reason: null'. Retrying attempt 4 in 16 seconds.
[2022-10-31T15:51:50.849+00:00][INFO ][savedobjects-service] [.kibana] CALCULATE_EXCLUDE_FILTERS -> CALCULATE_EXCLUDE_FILTERS. took: 8061ms.
[2022-10-31T15:52:06.874+00:00][ERROR][savedobjects-service] [.kibana] Action failed with 'search_phase_execution_exception: [no_shard_available_action_exception] Reason: null'. Retrying attempt 5 in 32 seconds.
[2022-10-31T15:52:06.874+00:00][INFO ][savedobjects-service] [.kibana] CALCULATE_EXCLUDE_FILTERS -> CALCULATE_EXCLUDE_FILTERS. took: 16043ms.
[2022-10-31T15:52:36.177+00:00][ERROR][savedobjects-service] [.kibana_task_manager] Action failed with '[index_not_yellow_timeout] Timeout waiting for the status of the [.kibana_task_manager_8.3.3_001] index to become 'yellow' Refer to https://www.elastic.co/guide/en/kibana/8.4/resolve-migrations-failures.html#_repeated_time_out_requests_that_eventually_fail for information on how to resolve the issue.'. Retrying attempt 1 in 2 seconds.
[2022-10-31T15:52:36.178+00:00][INFO ][savedobjects-service] [.kibana_task_manager] WAIT_FOR_YELLOW_SOURCE -> WAIT_FOR_YELLOW_SOURCE. took: 60063ms.
[2022-10-31T15:52:38.901+00:00][ERROR][savedobjects-service] [.kibana] Action failed with 'search_phase_execution_exception: [no_shard_available_action_exception] Reason: null'. Retrying attempt 6 in 64 seconds.
[2022-10-31T15:52:38.903+00:00][INFO ][savedobjects-service] [.kibana] CALCULATE_EXCLUDE_FILTERS -> CALCULATE_EXCLUDE_FILTERS. took: 32027ms.
[2022-10-31T15:53:38.190+00:00][ERROR][savedobjects-service] [.kibana_task_manager] Action failed with '[index_not_yellow_timeout] Timeout waiting for the status of the [.kibana_task_manager_8.3.3_001] index to become 'yellow' Refer to https://www.elastic.co/guide/en/kibana/8.4/resolve-migrations-failures.html#_repeated_time_out_requests_that_eventually_fail for information on how to resolve the issue.'. Retrying attempt 2 in 4 seconds.
[2022-10-31T15:53:38.191+00:00][INFO ][savedobjects-service] [.kibana_task_manager] WAIT_FOR_YELLOW_SOURCE -> WAIT_FOR_YELLOW_SOURCE. took: 62012ms.
[2022-10-31T15:53:43.005+00:00][ERROR][savedobjects-service] [.kibana] Action failed with 'search_phase_execution_exception: [no_shard_available_action_exception] Reason: null'. Retrying attempt 7 in 64 seconds.
[2022-10-31T15:53:43.005+00:00][INFO ][savedobjects-service] [.kibana] CALCULATE_EXCLUDE_FILTERS -> CALCULATE_EXCLUDE_FILTERS. took: 64104ms.
[2022-10-31T15:54:42.196+00:00][ERROR][savedobjects-service] [.kibana_task_manager] Action failed with '[index_not_yellow_timeout] Timeout waiting for the status of the [.kibana_task_manager_8.3.3_001] index to become 'yellow' Refer to https://www.elastic.co/guide/en/kibana/8.4/resolve-migrations-failures.html#_repeated_time_out_requests_that_eventually_fail for information on how to resolve the issue.'. Retrying attempt 3 in 8 seconds.
[2022-10-31T15:54:42.198+00:00][INFO ][savedobjects-service] [.kibana_task_manager] WAIT_FOR_YELLOW_SOURCE -> WAIT_FOR_YELLOW_SOURCE. took: 64007ms.
[2022-10-31T15:54:47.024+00:00][ERROR][savedobjects-service] [.kibana] Action failed with 'search_phase_execution_exception: [no_shard_available_action_exception] Reason: null'. Retrying attempt 8 in 64 seconds.
[2022-10-31T15:54:47.024+00:00][INFO ][savedobjects-service] [.kibana] CALCULATE_EXCLUDE_FILTERS -> CALCULATE_EXCLUDE_FILTERS. took: 64019ms.
[2022-10-31T15:55:50.202+00:00][ERROR][savedobjects-service] [.kibana_task_manager] Action failed with '[index_not_yellow_timeout] Timeout waiting for the status of the [.kibana_task_manager_8.3.3_001] index to become 'yellow' Refer to https://www.elastic.co/guide/en/kibana/8.4/resolve-migrations-failures.html#_repeated_time_out_requests_that_eventually_fail for information on how to resolve the issue.'. Retrying attempt 4 in 16 seconds.
[2022-10-31T15:55:50.202+00:00][INFO ][savedobjects-service] [.kibana_task_manager] WAIT_FOR_YELLOW_SOURCE -> WAIT_FOR_YELLOW_SOURCE. took: 68006ms.
[2022-10-31T15:55:51.037+00:00][ERROR][savedobjects-service] [.kibana] Action failed with 'search_phase_execution_exception: [no_shard_available_action_exception] Reason: null'. Retrying attempt 9 in 64 seconds.
[2022-10-31T15:55:51.037+00:00][INFO ][savedobjects-service] [.kibana] CALCULATE_EXCLUDE_FILTERS -> CALCULATE_EXCLUDE_FILTERS. took: 64013ms.
[2022-10-31T15:56:55.048+00:00][ERROR][savedobjects-service] [.kibana] Action failed with 'search_phase_execution_exception: [no_shard_available_action_exception] Reason: null'. Retrying attempt 10 in 64 seconds.
[2022-10-31T15:56:55.049+00:00][INFO ][savedobjects-service] [.kibana] CALCULATE_EXCLUDE_FILTERS -> CALCULATE_EXCLUDE_FILTERS. took: 64011ms.
[2022-10-31T15:57:06.208+00:00][ERROR][savedobjects-service] [.kibana_task_manager] Action failed with '[index_not_yellow_timeout] Timeout waiting for the status of the [.kibana_task_manager_8.3.3_001] index to become 'yellow' Refer to https://www.elastic.co/guide/en/kibana/8.4/resolve-migrations-failures.html#_repeated_time_out_requests_that_eventually_fail for information on how to resolve the issue.'. Retrying attempt 5 in 32 seconds.
[2022-10-31T15:57:06.208+00:00][INFO ][savedobjects-service] [.kibana_task_manager] WAIT_FOR_YELLOW_SOURCE -> WAIT_FOR_YELLOW_SOURCE. took: 76006ms.
[2022-10-31T15:57:59.060+00:00][ERROR][savedobjects-service] [.kibana] Action failed with 'search_phase_execution_exception: [no_shard_available_action_exception] Reason: null'. Retrying attempt 11 in 64 seconds.
[2022-10-31T15:57:59.060+00:00][INFO ][savedobjects-service] [.kibana] CALCULATE_EXCLUDE_FILTERS -> CALCULATE_EXCLUDE_FILTERS. took: 64012ms.
[2022-10-31T15:58:38.213+00:00][ERROR][savedobjects-service] [.kibana_task_manager] Action failed with '[index_not_yellow_timeout] Timeout waiting for the status of the [.kibana_task_manager_8.3.3_001] index to become 'yellow' Refer to https://www.elastic.co/guide/en/kibana/8.4/resolve-migrations-failures.html#_repeated_time_out_requests_that_eventually_fail for information on how to resolve the issue.'. Retrying attempt 6 in 64 seconds.
[2022-10-31T15:58:38.213+00:00][INFO ][savedobjects-service] [.kibana_task_manager] WAIT_FOR_YELLOW_SOURCE -> WAIT_FOR_YELLOW_SOURCE. took: 92005ms.
[2022-10-31T15:59:03.074+00:00][ERROR][savedobjects-service] [.kibana] Action failed with 'search_phase_execution_exception: [no_shard_available_action_exception] Reason: null'. Retrying attempt 12 in 64 seconds.
[2022-10-31T15:59:03.074+00:00][INFO ][savedobjects-service] [.kibana] CALCULATE_EXCLUDE_FILTERS -> CALCULATE_EXCLUDE_FILTERS. took: 64014ms.
[2022-10-31T16:00:07.085+00:00][ERROR][savedobjects-service] [.kibana] Action failed with 'search_phase_execution_exception: [no_shard_available_action_exception] Reason: null'. Retrying attempt 13 in 64 seconds.
[2022-10-31T16:00:07.085+00:00][INFO ][savedobjects-service] [.kibana] CALCULATE_EXCLUDE_FILTERS -> CALCULATE_EXCLUDE_FILTERS. took: 64011ms.
[2022-10-31T16:00:42.218+00:00][ERROR][savedobjects-service] [.kibana_task_manager] Action failed with '[index_not_yellow_timeout] Timeout waiting for the status of the [.kibana_task_manager_8.3.3_001] index to become 'yellow' Refer to https://www.elastic.co/guide/en/kibana/8.4/resolve-migrations-failures.html#_repeated_time_out_requests_that_eventually_fail for information on how to resolve the issue.'. Retrying attempt 7 in 64 seconds.
[2022-10-31T16:00:42.218+00:00][INFO ][savedobjects-service] [.kibana_task_manager] WAIT_FOR_YELLOW_SOURCE -> WAIT_FOR_YELLOW_SOURCE. took: 124005ms.
[2022-10-31T16:01:11.098+00:00][ERROR][savedobjects-service] [.kibana] Action failed with 'search_phase_execution_exception: [no_shard_available_action_exception] Reason: null'. Retrying attempt 14 in 64 seconds.
[2022-10-31T16:01:11.099+00:00][INFO ][savedobjects-service] [.kibana] CALCULATE_EXCLUDE_FILTERS -> CALCULATE_EXCLUDE_FILTERS. took: 64013ms.
[2022-10-31T16:02:15.111+00:00][ERROR][savedobjects-service] [.kibana] Action failed with 'search_phase_execution_exception: [no_shard_available_action_exception] Reason: null'. Retrying attempt 15 in 64 seconds.
[2022-10-31T16:02:15.111+00:00][INFO ][savedobjects-service] [.kibana] CALCULATE_EXCLUDE_FILTERS -> CALCULATE_EXCLUDE_FILTERS. took: 64013ms.
[2022-10-31T16:02:46.223+00:00][ERROR][savedobjects-service] [.kibana_task_manager] Action failed with '[index_not_yellow_timeout] Timeout waiting for the status of the [.kibana_task_manager_8.3.3_001] index to become 'yellow' Refer to https://www.elastic.co/guide/en/kibana/8.4/resolve-migrations-failures.html#_repeated_time_out_requests_that_eventually_fail for information on how to resolve the issue.'. Retrying attempt 8 in 64 seconds.
[2022-10-31T16:02:46.224+00:00][INFO ][savedobjects-service] [.kibana_task_manager] WAIT_FOR_YELLOW_SOURCE -> WAIT_FOR_YELLOW_SOURCE. took: 124005ms.
[2022-10-31T16:03:19.126+00:00][INFO ][savedobjects-service] [.kibana] CALCULATE_EXCLUDE_FILTERS -> FATAL. took: 64015ms.
[2022-10-31T16:03:19.128+00:00][FATAL][root] Error: Unable to complete saved object migrations for the [.kibana] index: Unable to complete the CALCULATE_EXCLUDE_FILTERS step after 15 attempts, terminating. The last failure message was: search_phase_execution_exception: [no_shard_available_action_exception] Reason: null
at migrationStateActionMachine (/usr/share/kibana/src/core/server/saved_objects/migrations/migrations_state_action_machine.js:144:29)
at runMicrotasks ()
at processTicksAndRejections (node:internal/process/task_queues:96:5)
at async Promise.all (index 0)
at SavedObjectsService.start (/usr/share/kibana/src/core/server/saved_objects/saved_objects_service.js:214:9)
at Server.start (/usr/share/kibana/src/core/server/server.js:369:31)
at Root.start (/usr/share/kibana/src/core/server/root/index.js:69:14)
at bootstrap (/usr/share/kibana/src/core/server/bootstrap.js:120:5)
at Command. (/usr/share/kibana/src/cli/serve/serve.js:216:5)
[2022-10-31T16:03:19.145+00:00][INFO ][plugins-system.preboot] Stopping all plugins.
[2022-10-31T16:03:19.147+00:00][INFO ][plugins-system.standard] Stopping all plugins.
[2022-10-31T16:03:19.148+00:00][INFO ][plugins.monitoring.monitoring.kibana-monitoring] Monitoring stats collection is stopped
[2022-10-31T16:03:19.155+00:00][ERROR][plugins.ruleRegistry] Error: Server is stopping; must stop all async operations
at /usr/share/kibana/x-pack/plugins/rule_registry/server/rule_data_plugin_service/resource_installer.js:66:20
at runMicrotasks ()
at processTicksAndRejections (node:internal/process/task_queues:96:5)
[2022-10-31T16:03:19.158+00:00][ERROR][plugins.ruleRegistry] Error: Failure installing common resources shared between all indices. Server is stopping; must stop all async operations
at ResourceInstaller.installWithTimeout (/usr/share/kibana/x-pack/plugins/rule_registry/server/rule_data_plugin_service/resource_installer.js:75:13)
at runMicrotasks ()
at processTicksAndRejections (node:internal/process/task_queues:96:5)
at ResourceInstaller.installCommonResources (/usr/share/kibana/x-pack/plugins/rule_registry/server/rule_data_plugin_service/resource_installer.js:89:5)
FATAL Error: Unable to complete saved object migrations for the [.kibana] index: Unable to complete the CALCULATE_EXCLUDE_FILTERS step after 15 attempts, terminating. The last failure message was: search_phase_execution_exception: [no_shard_available_action_exception] Reason: null
[2022-10-31T21:17:05.207+00:00][INFO ][node] Kibana process configured with roles: [background_tasks, ui]
[2022-10-31T21:17:24.449+00:00][INFO ][http.server.Preboot] http server running at http://0.0.0.0:5601
[2022-10-31T21:17:24.508+00:00][INFO ][plugins-system.preboot] Setting up [1] plugins: [interactiveSetup]
[2022-10-31T21:17:24.546+00:00][WARN ][config.deprecation] You should set server.basePath along with server.rewriteBasePath. Starting in 7.0, Kibana will expect that all requests start with server.basePath rather than expecting you to rewrite the requests in your reverse proxy. Set server.rewriteBasePath to false to preserve the current behavior and silence this warning.
[2022-10-31T21:17:24.546+00:00][WARN ][config.deprecation] The default mechanism for Reporting privileges will work differently in future versions, which will affect the behavior of this cluster. Set "xpack.reporting.roles.enabled" to "false" to adopt the future behavior before upgrading.
[2022-10-31T21:17:24.547+00:00][WARN ][config.deprecation] Setting "security.showInsecureClusterWarning" has been replaced by "xpack.security.showInsecureClusterWarning"
[2022-10-31T21:17:24.791+00:00][INFO ][plugins-system.standard] Setting up [121] plugins: [translations,monitoringCollection,licensing,globalSearch,globalSearchProviders,features,mapsEms,licenseApiGuard,usageCollection,taskManager,telemetryCollectionManager,telemetryCollectionXpack,kibanaUsageCollection,share,embeddable,uiActionsEnhanced,screenshotMode,banners,newsfeed,fieldFormats,expressions,dataViews,charts,esUiShared,customIntegrations,home,searchprofiler,painlessLab,grokdebugger,management,advancedSettings,spaces,security,lists,encryptedSavedObjects,cloud,snapshotRestore,screenshotting,telemetry,licenseManagement,eventLog,actions,console,bfetch,data,watcher,reporting,fileUpload,ingestPipelines,alerting,unifiedSearch,savedObjects,graph,savedObjectsTagging,savedObjectsManagement,presentationUtil,expressionShape,expressionRevealImage,expressionRepeatImage,expressionMetric,expressionImage,controls,eventAnnotation,dataViewFieldEditor,triggersActionsUi,transform,stackAlerts,ruleRegistry,discover,fleet,indexManagement,remoteClusters,crossClusterReplication,indexLifecycleManagement,cloudSecurityPosture,discoverEnhanced,aiops,visualizations,canvas,visTypeXy,visTypeVislib,visTypeVega,visTypeTimeseries,rollup,visTypeTimelion,visTypeTagcloud,visTypeTable,visTypeMetric,visTypeHeatmap,visTypeMarkdown,dashboard,dashboardEnhanced,expressionXY,expressionTagcloud,expressionPartitionVis,visTypePie,expressionMetricVis,expressionLegacyMetricVis,expressionHeatmap,expressionGauge,lens,osquery,maps,dataVisualizer,ml,cases,timelines,sessionView,kubernetesSecurity,securitySolution,visTypeGauge,sharedUX,observability,synthetics,infra,upgradeAssistant,monitoring,logstash,enterpriseSearch,apm,dataViewManagement]
[2022-10-31T21:17:24.809+00:00][INFO ][plugins.taskManager] TaskManager is identified by the Kibana UUID: 4224f424-22b0-4508-bed5-54ace6c7a377
[2022-10-31T21:17:24.911+00:00][WARN ][plugins.security.config] Using secure cookies, but SSL is not enabled inside Kibana. SSL must be configured outside of Kibana to function properly.
[2022-10-31T21:17:24.935+00:00][WARN ][plugins.security.config] Using secure cookies, but SSL is not enabled inside Kibana. SSL must be configured outside of Kibana to function properly.
[2022-10-31T21:17:24.943+00:00][INFO ][plugins.encryptedSavedObjects] Hashed 'xpack.encryptedSavedObjects.encryptionKey' for this instance: IyIOEUYgs5MKLHvd0RoZ+7db76GTnPZ4iKj65xtZbUY=
[2022-10-31T21:17:25.119+00:00][WARN ][plugins.reporting.config] Found 'server.host: "0.0.0.0"' in Kibana configuration. Reporting is not able to use this as the Kibana server hostname. To enable PNG/PDF Reporting to work, 'xpack.reporting.kibanaServer.hostname: localhost' is automatically set in the configuration. You can prevent this message by adding 'xpack.reporting.kibanaServer.hostname: localhost' in kibana.yml.
[2022-10-31T21:17:25.170+00:00][INFO ][plugins.ruleRegistry] Installing common resources shared between all indices
[2022-10-31T21:17:25.272+00:00][INFO ][plugins.cloudSecurityPosture] Registered task successfully [Task: cloud_security_posture-stats_task]
[2022-10-31T21:17:26.411+00:00][INFO ][plugins.screenshotting.config] Chromium sandbox provides an additional layer of protection, and is supported for Linux Ubuntu 20.04 OS. Automatically enabling Chromium sandbox.
[2022-10-31T21:17:26.661+00:00][INFO ][savedobjects-service] Waiting until all Elasticsearch nodes are compatible with Kibana before starting saved objects migrations...
[2022-10-31T21:17:26.661+00:00][INFO ][savedobjects-service] Starting saved objects migrations
[2022-10-31T21:17:26.812+00:00][INFO ][savedobjects-service] [.kibana] INIT -> WAIT_FOR_YELLOW_SOURCE. took: 126ms.
[2022-10-31T21:17:26.815+00:00][INFO ][savedobjects-service] [.kibana_task_manager] INIT -> WAIT_FOR_YELLOW_SOURCE. took: 123ms.
[2022-10-31T21:17:26.821+00:00][INFO ][savedobjects-service] [.kibana] WAIT_FOR_YELLOW_SOURCE -> CHECK_UNKNOWN_DOCUMENTS. took: 9ms.
[2022-10-31T21:17:27.068+00:00][INFO ][savedobjects-service] [.kibana] CHECK_UNKNOWN_DOCUMENTS -> SET_SOURCE_WRITE_BLOCK. took: 247ms.
[2022-10-31T21:17:27.082+00:00][INFO ][savedobjects-service] [.kibana] SET_SOURCE_WRITE_BLOCK -> CALCULATE_EXCLUDE_FILTERS. took: 14ms.
[2022-10-31T21:17:27.129+00:00][ERROR][savedobjects-service] [.kibana] Action failed with 'search_phase_execution_exception: [no_shard_available_action_exception] Reason: null'. Retrying attempt 1 in 2 seconds.
[2022-10-31T21:17:27.129+00:00][INFO ][savedobjects-service] [.kibana] CALCULATE_EXCLUDE_FILTERS -> CALCULATE_EXCLUDE_FILTERS. took: 47ms.
[2022-10-31T21:17:29.146+00:00][ERROR][savedobjects-service] [.kibana] Action failed with 'search_phase_execution_exception: [no_shard_available_action_exception] Reason: null'. Retrying attempt 2 in 4 seconds.
[2022-10-31T21:17:29.147+00:00][INFO ][savedobjects-service] [.kibana] CALCULATE_EXCLUDE_FILTERS -> CALCULATE_EXCLUDE_FILTERS. took: 2017ms.
[2022-10-31T21:17:29.679+00:00][INFO ][plugins.screenshotting.chromium] Browser executable: /usr/share/kibana/x-pack/plugins/screenshotting/chromium/headless_shell-linux_x64/headless_shell
[2022-10-31T21:17:33.279+00:00][ERROR][savedobjects-service] [.kibana] Action failed with 'search_phase_execution_exception: [no_shard_available_action_exception] Reason: null'. Retrying attempt 3 in 8 seconds.
[2022-10-31T21:17:33.282+00:00][INFO ][savedobjects-service] [.kibana] CALCULATE_EXCLUDE_FILTERS -> CALCULATE_EXCLUDE_FILTERS. took: 4133ms.
[2022-10-31T21:17:41.588+00:00][ERROR][savedobjects-service] [.kibana] Action failed with 'search_phase_execution_exception: [no_shard_available_action_exception] Reason: null'. Retrying attempt 4 in 16 seconds.
[2022-10-31T21:17:41.591+00:00][INFO ][savedobjects-service] [.kibana] CALCULATE_EXCLUDE_FILTERS -> CALCULATE_EXCLUDE_FILTERS. took: 8309ms.
[2022-10-31T21:17:57.755+00:00][ERROR][savedobjects-service] [.kibana] Action failed with 'search_phase_execution_exception: [no_shard_available_action_exception] Reason: null'. Retrying attempt 5 in 32 seconds.
[2022-10-31T21:17:57.758+00:00][INFO ][savedobjects-service] [.kibana] CALCULATE_EXCLUDE_FILTERS -> CALCULATE_EXCLUDE_FILTERS. took: 16167ms.
[2022-10-31T21:18:26.835+00:00][ERROR][savedobjects-service] [.kibana_task_manager] Action failed with '[index_not_yellow_timeout] Timeout waiting for the status of the [.kibana_task_manager_8.3.3_001] index to become 'yellow' Refer to https://www.elastic.co/guide/en/kibana/8.4/resolve-migrations-failures.html#_repeated_time_out_requests_that_eventually_fail for information on how to resolve the issue.'. Retrying attempt 1 in 2 seconds.
[2022-10-31T21:18:26.836+00:00][INFO ][savedobjects-service] [.kibana_task_manager] WAIT_FOR_YELLOW_SOURCE -> WAIT_FOR_YELLOW_SOURCE. took: 60020ms.
[2022-10-31T21:18:29.876+00:00][ERROR][savedobjects-service] [.kibana] Action failed with 'search_phase_execution_exception: [no_shard_available_action_exception] Reason: null'. Retrying attempt 6 in 64 seconds.
[2022-10-31T21:18:29.879+00:00][INFO ][savedobjects-service] [.kibana] CALCULATE_EXCLUDE_FILTERS -> CALCULATE_EXCLUDE_FILTERS. took: 32121ms.
[2022-10-31T21:19:28.849+00:00][ERROR][savedobjects-service] [.kibana_task_manager] Action failed with '[index_not_yellow_timeout] Timeout waiting for the status of the [.kibana_task_manager_8.3.3_001] index to become 'yellow' Refer to https://www.elastic.co/guide/en/kibana/8.4/resolve-migrations-failures.html#_repeated_time_out_requests_that_eventually_fail for information on how to resolve the issue.'. Retrying attempt 2 in 4 seconds.
[2022-10-31T21:19:28.850+00:00][INFO ][savedobjects-service] [.kibana_task_manager] WAIT_FOR_YELLOW_SOURCE -> WAIT_FOR_YELLOW_SOURCE. took: 62014ms.
[2022-10-31T21:19:34.095+00:00][ERROR][savedobjects-service] [.kibana] Action failed with 'search_phase_execution_exception: [no_shard_available_action_exception] Reason: null'. Retrying attempt 7 in 64 seconds.
[2022-10-31T21:19:34.095+00:00][INFO ][savedobjects-service] [.kibana] CALCULATE_EXCLUDE_FILTERS -> CALCULATE_EXCLUDE_FILTERS. took: 64219ms.
[2022-10-31T21:20:32.868+00:00][ERROR][savedobjects-service] [.kibana_task_manager] Action failed with '[index_not_yellow_timeout] Timeout waiting for the status of the [.kibana_task_manager_8.3.3_001] index to become 'yellow' Refer to https://www.elastic.co/guide/en/kibana/8.4/resolve-migrations-failures.html#_repeated_time_out_requests_that_eventually_fail for information on how to resolve the issue.'. Retrying attempt 3 in 8 seconds.
[2022-10-31T21:20:32.869+00:00][INFO ][savedobjects-service] [.kibana_task_manager] WAIT_FOR_YELLOW_SOURCE -> WAIT_FOR_YELLOW_SOURCE. took: 64019ms.
[2022-10-31T21:20:38.115+00:00][ERROR][savedobjects-service] [.kibana] Action failed with 'search_phase_execution_exception: [no_shard_available_action_exception] Reason: null'. Retrying attempt 8 in 64 seconds.
[2022-10-31T21:20:38.115+00:00][INFO ][savedobjects-service] [.kibana] CALCULATE_EXCLUDE_FILTERS -> CALCULATE_EXCLUDE_FILTERS. took: 64020ms.
[2022-10-31T21:21:40.876+00:00][ERROR][savedobjects-service] [.kibana_task_manager] Action failed with '[index_not_yellow_timeout] Timeout waiting for the status of the [.kibana_task_manager_8.3.3_001] index to become 'yellow' Refer to https://www.elastic.co/guide/en/kibana/8.4/resolve-migrations-failures.html#_repeated_time_out_requests_that_eventually_fail for information on how to resolve the issue.'. Retrying attempt 4 in 16 seconds.
[2022-10-31T21:21:40.878+00:00][INFO ][savedobjects-service] [.kibana_task_manager] WAIT_FOR_YELLOW_SOURCE -> WAIT_FOR_YELLOW_SOURCE. took: 68008ms.
[2022-10-31T21:21:42.131+00:00][ERROR][savedobjects-service] [.kibana] Action failed with 'search_phase_execution_exception: [no_shard_available_action_exception] Reason: null'. Retrying attempt 9 in 64 seconds.
[2022-10-31T21:21:42.131+00:00][INFO ][savedobjects-service] [.kibana] CALCULATE_EXCLUDE_FILTERS -> CALCULATE_EXCLUDE_FILTERS. took: 64016ms.
[2022-10-31T21:22:46.149+00:00][ERROR][savedobjects-service] [.kibana] Action failed with 'search_phase_execution_exception: [no_shard_available_action_exception] Reason: null'. Retrying attempt 10 in 64 seconds.
[2022-10-31T21:22:46.150+00:00][INFO ][savedobjects-service] [.kibana] CALCULATE_EXCLUDE_FILTERS -> CALCULATE_EXCLUDE_FILTERS. took: 64018ms.
[2022-10-31T21:22:56.887+00:00][ERROR][savedobjects-service] [.kibana_task_manager] Action failed with '[index_not_yellow_timeout] Timeout waiting for the status of the [.kibana_task_manager_8.3.3_001] index to become 'yellow' Refer to https://www.elastic.co/guide/en/kibana/8.4/resolve-migrations-failures.html#_repeated_time_out_requests_that_eventually_fail for information on how to resolve the issue.'. Retrying attempt 5 in 32 seconds.
[2022-10-31T21:22:56.888+00:00][INFO ][savedobjects-service] [.kibana_task_manager] WAIT_FOR_YELLOW_SOURCE -> WAIT_FOR_YELLOW_SOURCE. took: 76011ms.
[2022-10-31T21:23:50.163+00:00][ERROR][savedobjects-service] [.kibana] Action failed with 'search_phase_execution_exception: [no_shard_available_action_exception] Reason: null'. Retrying attempt 11 in 64 seconds.
[2022-10-31T21:23:50.164+00:00][INFO ][savedobjects-service] [.kibana] CALCULATE_EXCLUDE_FILTERS -> CALCULATE_EXCLUDE_FILTERS. took: 64014ms.
[2022-10-31T21:24:28.958+00:00][ERROR][savedobjects-service] [.kibana_task_manager] Action failed with '[index_not_yellow_timeout] Timeout waiting for the status of the [.kibana_task_manager_8.3.3_001] index to become 'yellow' Refer to https://www.elastic.co/guide/en/kibana/8.4/resolve-migrations-failures.html#_repeated_time_out_requests_that_eventually_fail for information on how to resolve the issue.'. Retrying attempt 6 in 64 seconds.
[2022-10-31T21:24:28.959+00:00][INFO ][savedobjects-service] [.kibana_task_manager] WAIT_FOR_YELLOW_SOURCE -> WAIT_FOR_YELLOW_SOURCE. took: 92071ms.
[2022-10-31T21:24:54.176+00:00][ERROR][savedobjects-service] [.kibana] Action failed with 'search_phase_execution_exception: [no_shard_available_action_exception] Reason: null'. Retrying attempt 12 in 64 seconds.
[2022-10-31T21:24:54.176+00:00][INFO ][savedobjects-service] [.kibana] CALCULATE_EXCLUDE_FILTERS -> CALCULATE_EXCLUDE_FILTERS. took: 64013ms.
[2022-10-31T21:25:58.187+00:00][ERROR][savedobjects-service] [.kibana] Action failed with 'search_phase_execution_exception: [no_shard_available_action_exception] Reason: null'. Retrying attempt 13 in 64 seconds.
[2022-10-31T21:25:58.187+00:00][INFO ][savedobjects-service] [.kibana] CALCULATE_EXCLUDE_FILTERS -> CALCULATE_EXCLUDE_FILTERS. took: 64011ms.
[2022-10-31T21:26:32.964+00:00][ERROR][savedobjects-service] [.kibana_task_manager] Action failed with '[index_not_yellow_timeout] Timeout waiting for the status of the [.kibana_task_manager_8.3.3_001] index to become 'yellow' Refer to https://www.elastic.co/guide/en/kibana/8.4/resolve-migrations-failures.html#_repeated_time_out_requests_that_eventually_fail for information on how to resolve the issue.'. Retrying attempt 7 in 64 seconds.
[2022-10-31T21:26:32.964+00:00][INFO ][savedobjects-service] [.kibana_task_manager] WAIT_FOR_YELLOW_SOURCE -> WAIT_FOR_YELLOW_SOURCE. took: 124006ms.
[2022-10-31T21:27:02.198+00:00][ERROR][savedobjects-service] [.kibana] Action failed with 'search_phase_execution_exception: [no_shard_available_action_exception] Reason: null'. Retrying attempt 14 in 64 seconds.
[2022-10-31T21:27:02.199+00:00][INFO ][savedobjects-service] [.kibana] CALCULATE_EXCLUDE_FILTERS -> CALCULATE_EXCLUDE_FILTERS. took: 64011ms.
[2022-10-31T21:28:06.209+00:00][ERROR][savedobjects-service] [.kibana] Action failed with 'search_phase_execution_exception: [no_shard_available_action_exception] Reason: null'. Retrying attempt 15 in 64 seconds.
[2022-10-31T21:28:06.209+00:00][INFO ][savedobjects-service] [.kibana] CALCULATE_EXCLUDE_FILTERS -> CALCULATE_EXCLUDE_FILTERS. took: 64011ms.
[2022-10-31T21:28:36.968+00:00][ERROR][savedobjects-service] [.kibana_task_manager] Action failed with '[index_not_yellow_timeout] Timeout waiting for the status of the [.kibana_task_manager_8.3.3_001] index to become 'yellow' Refer to https://www.elastic.co/guide/en/kibana/8.4/resolve-migrations-failures.html#_repeated_time_out_requests_that_eventually_fail for information on how to resolve the issue.'. Retrying attempt 8 in 64 seconds.
[2022-10-31T21:28:36.968+00:00][INFO ][savedobjects-service] [.kibana_task_manager] WAIT_FOR_YELLOW_SOURCE -> WAIT_FOR_YELLOW_SOURCE. took: 124003ms.
[2022-10-31T21:29:10.235+00:00][INFO ][savedobjects-service] [.kibana] CALCULATE_EXCLUDE_FILTERS -> FATAL. took: 64026ms.
[2022-10-31T21:29:10.238+00:00][FATAL][root] Error: Unable to complete saved object migrations for the [.kibana] index: Unable to complete the CALCULATE_EXCLUDE_FILTERS step after 15 attempts, terminating. The last failure message was: search_phase_execution_exception: [no_shard_available_action_exception] Reason: null
at migrationStateActionMachine (/usr/share/kibana/src/core/server/saved_objects/migrations/migrations_state_action_machine.js:144:29)
at processTicksAndRejections (node:internal/process/task_queues:96:5)
at async Promise.all (index 0)
at SavedObjectsService.start (/usr/share/kibana/src/core/server/saved_objects/saved_objects_service.js:214:9)
at Server.start (/usr/share/kibana/src/core/server/server.js:369:31)
at Root.start (/usr/share/kibana/src/core/server/root/index.js:69:14)
at bootstrap (/usr/share/kibana/src/core/server/bootstrap.js:120:5)
at Command. (/usr/share/kibana/src/cli/serve/serve.js:216:5)
[2022-10-31T21:29:10.261+00:00][INFO ][plugins-system.preboot] Stopping all plugins.
[2022-10-31T21:29:10.265+00:00][INFO ][plugins-system.standard] Stopping all plugins.
[2022-10-31T21:29:10.265+00:00][INFO ][plugins.monitoring.monitoring.kibana-monitoring] Monitoring stats collection is stopped
[2022-10-31T21:29:10.278+00:00][ERROR][plugins.ruleRegistry] Error: Server is stopping; must stop all async operations
at /usr/share/kibana/x-pack/plugins/rule_registry/server/rule_data_plugin_service/resource_installer.js:66:20
at processTicksAndRejections (node:internal/process/task_queues:96:5)
[2022-10-31T21:29:10.280+00:00][ERROR][plugins.ruleRegistry] Error: Failure installing common resources shared between all indices. Server is stopping; must stop all async operations
at ResourceInstaller.installWithTimeout (/usr/share/kibana/x-pack/plugins/rule_registry/server/rule_data_plugin_service/resource_installer.js:75:13)
at processTicksAndRejections (node:internal/process/task_queues:96:5)
at ResourceInstaller.installCommonResources (/usr/share/kibana/x-pack/plugins/rule_registry/server/rule_data_plugin_service/resource_installer.js:89:5)
FATAL Error: Unable to complete saved object migrations for the [.kibana] index: Unable to complete the CALCULATE_EXCLUDE_FILTERS step after 15 attempts, terminating. The last failure message was: search_phase_execution_exception: [no_shard_available_action_exception] Reason: null
Any hints ?
Beta Was this translation helpful? Give feedback.
All reactions