Not seeing traffic in grafana #9311
Replies: 2 comments 6 replies
-
|
I am also on ESXi using VLAN 4095 promiscuous mode and this works, I don't think that is your issue. Is it just grafana? Do you get Zeek connection logs?
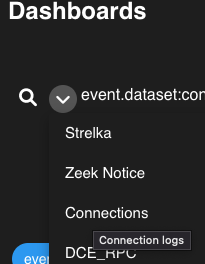
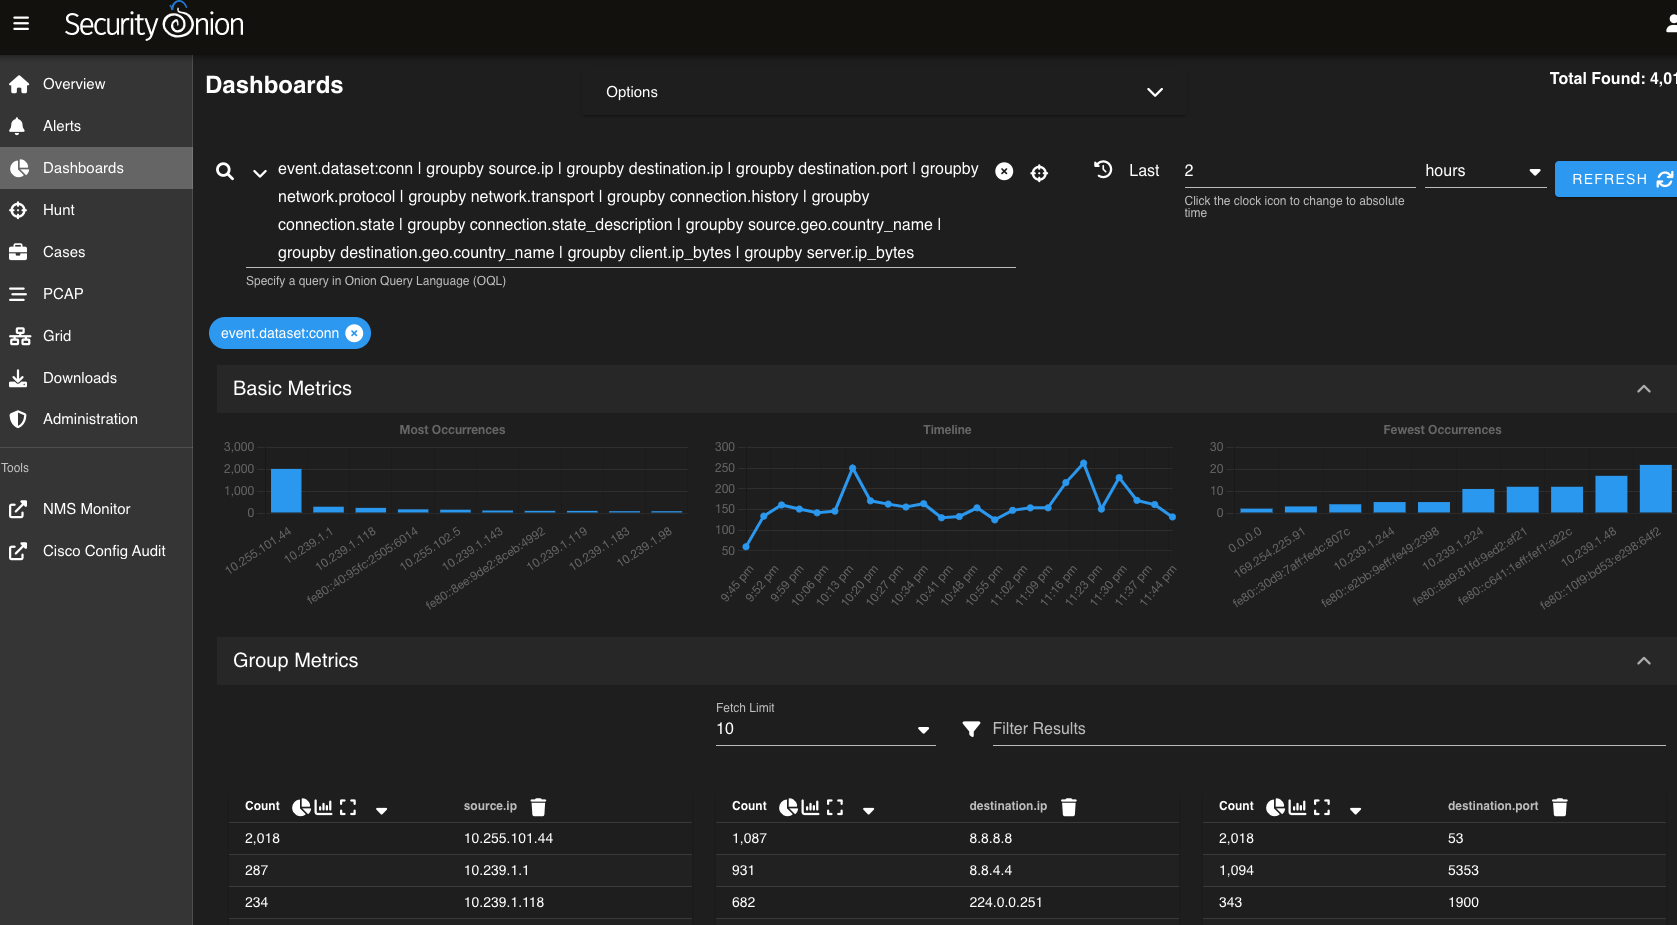
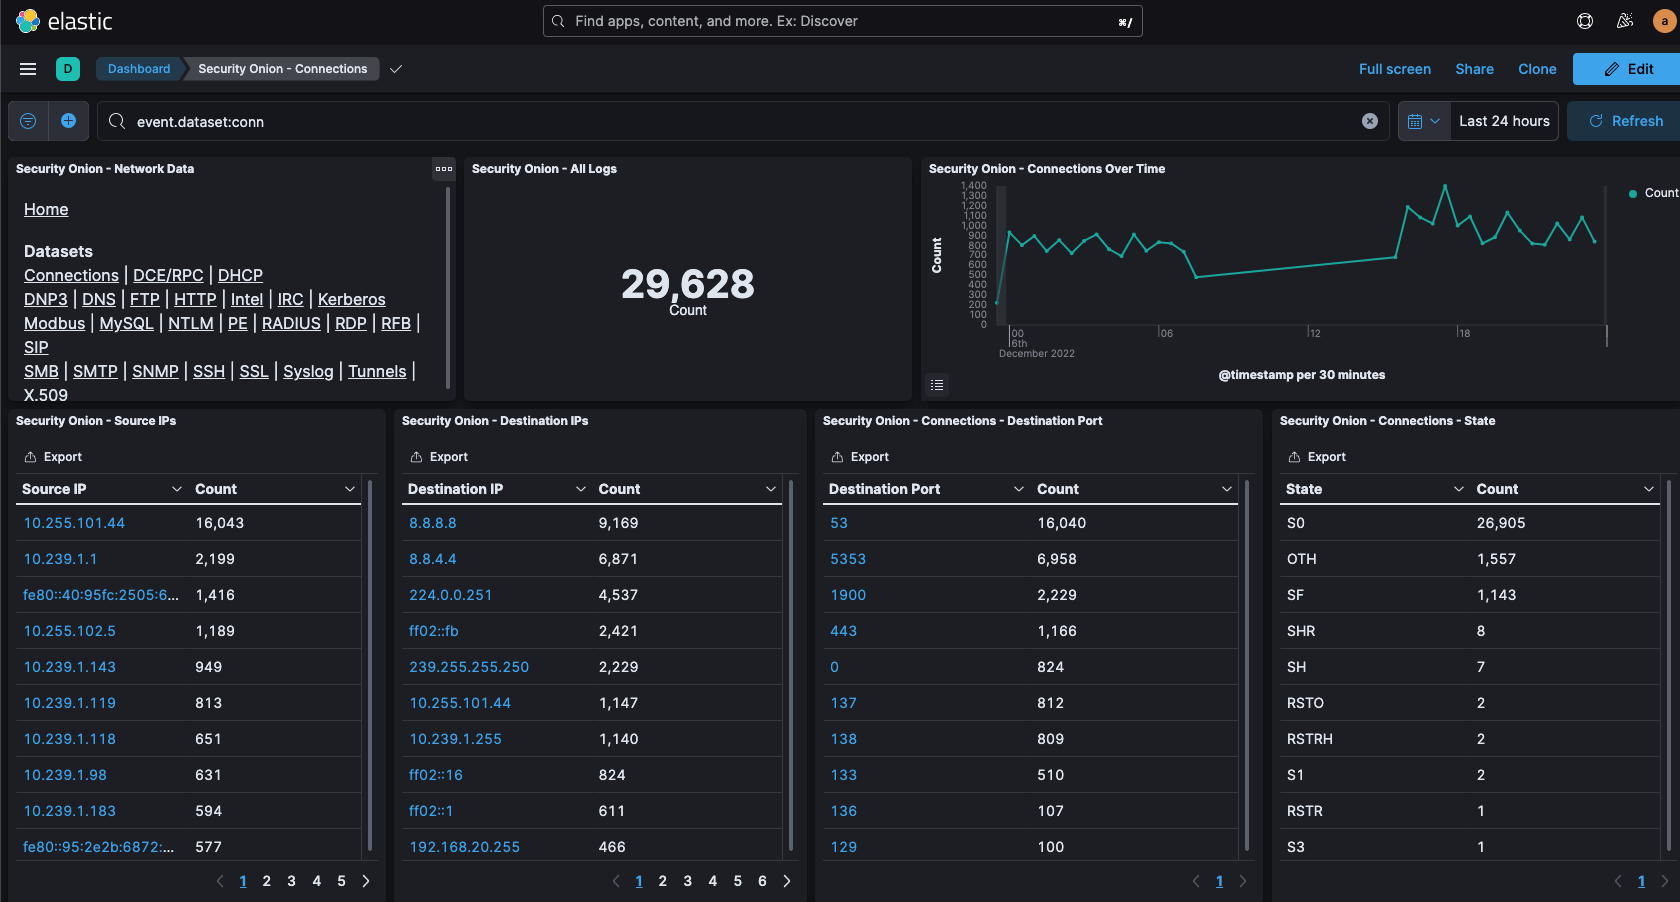
or you can go to Kibana > Dashboards > Security Onion Connections Do you see data? If Zeek connection logs has data in Kibana and it is just Grafana. I have seen similar Grafana issue on my system when the ESXi time is not properly set. SO will get its time from the ESXi host unless it is on NTP. Was it working before? |
Beta Was this translation helpful? Give feedback.
-
|
Thank you for your reply. I checked kibana and the connection dashboard it shows 0 for everything. Sec onions vm and tcpreplay are on the same esxi. I tried tcpreplay on the sensor node itself and it did not work either. In my initial set up I choice suricata instead of zeek. I have a feeling its my vcenter configuration for some reason. My vcenter is setup is like this: I have a Vswitch and I set the vlan ID to 4095. In the topology its connected to a physical adapter. Sensor node and tcpreplay have the same vlan assigned. The sensor node has two interfaces one is the main ip and one is the 4095 vlan. Is that ok? I want to note that there is no vmkernel port for it. Not sure if it needs it. If you think I have something missing on the vcenter side can you post your network topology settings? Also my NTP settings are coming from my management node |
Beta Was this translation helpful? Give feedback.
-
|
"My vcenter is setup is like this: I have a Vswitch and I set the vlan ID to 4095. In the topology its connected to a physical adapter. Sensor node and tcpreplay have the same vlan assigned. The sensor node has two interfaces one is the main ip and one is the 4095 vlan. Is that ok?" "I want to note that there is no vmkernel port for it. Not sure if it needs it. If you think I have something missing on the vcenter side can you post your network topology settings?" I will send screenshot but nothing is jumping out as misconfiguration on the ESXi. "In my initial set up I choice suricata instead of zeek" Give me this info below:
|
Beta Was this translation helpful? Give feedback.
-
|
Hi I found my error, in my intial installation I had changed the ip and noticed it was still in the global.sls. I wiped and reinstalled and I can get packets now. However I am seeing a lot of stenographer packet loss and .12% suricata packet loss. I did some tuning with af-packets, ring-size, and max-pending-packets. Are you seeing that as well? The esxi host is on the a vsan. |
Beta Was this translation helpful? Give feedback.
-
|
How much packet throughput are you ingesting? Im still on proof of concept so my traffic are very low. and although I do have vsan on my cluster I am not planning to put SO on my vsan, I dont want to get blame on being a noisy neighbor and robbing all the disk iops from more important vm. How much vcpu did you give SO? I think you can tweak the cpu core count of Suricata in global.sls. You need to find out where the bottleneck, is it cpu, mem, storage, nic. If it was me I would use htop to see if it is cpu or mem. I would move it away from vsan and put it on local ssd. If it is nic, I would passthrough temporarily. Also I would use Intel nic with ixgben or i40en driver this is very important. The ixgben is the older intel nic but that is the most solid. When you reinstall did you choose Suricata again for metadata? I did comparison with Zeek and Suri for metadata and I still find Zeek as better. Zeek seems to have more fields like client.bytes or server.bytes that I like to filter on. Maybe sometime in the future I will revisit the idea. |
Beta Was this translation helpful? Give feedback.
-
|
I have a pcap file that I am running on loop 5000 times. I gave my SO 48 CPU and 4 core per socket. I made the suriprocs:22 in /opt/so/saltstack/local/pillar/minions/$sensor_name. I chose Zeek for metadata. |
Beta Was this translation helpful? Give feedback.
-
|
"I gave my SO 48 CPU and 4 core per socket" |
Beta Was this translation helpful? Give feedback.
-
|
wait I think i know what is wrong, I notice you use tcpreplay "--topspeed", try "--mbps" and dial it down. I'm curious on your Grafana "Security Onion Grid Overview" what does it say on you "Monitor Interface Traffic - Inbound"? how much mbps is it showing when you run tcpreplay with --topspeed? |
Beta Was this translation helpful? Give feedback.
Uh oh!
There was an error while loading. Please reload this page.
-
I am having trouble seeing "Monitor traffic" in grafana. It just says NA.
I set up a distributed sec onion environment. It consist of 1 manage node, 1 search, and one sensor/forward node.
My set up is in vcenter. I created a port group with VLAN 4095, promiscuous mode and mac address changes to accept.
My management IP on all three also has promiscuous set to true but does not have vlan 4095.
I am pushing traffic with another machine using tcpreplay "tcpreplay -i ens256 --topspeed --loop 50000 name.pcap" This machine has the same port group as the search node (vlan 4059 etc)
on the sensor node if I do "watch -d "ifconfig ens224" I can see the data being pushed.
is there something I am missing?
Beta Was this translation helpful? Give feedback.
All reactions