Manager Grid EPS #9752
-
|
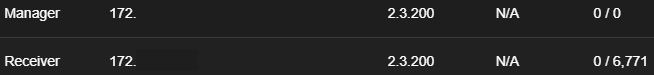
Is anyone else's Grid showing a manager node w/ EPS of 0/0? Distributed v2.3.200 deployment here w/ a manager + receiver node. Manager status is OK and consuming events per Grafana but Grid isn't reflecting.
|
Beta Was this translation helpful? Give feedback.
Replies: 1 comment 5 replies
-
|
Does everything look normal in Grafana for those nodes? That is, does it show the expected level of traffic on the management ports and in the ingestion pipeline? |
Beta Was this translation helpful? Give feedback.
-
|
Yes, everything looks good via Grafana for the manager. Checked the raw output of |
Beta Was this translation helpful? Give feedback.
-
|
Just wanted to report this issue still persists w/ a fresh install using the latest SOv2.4.30 ISO.
|

Beta Was this translation helpful? Give feedback.
-
|
In 2.3, there were both Production EPS and Consumption EPS: In 2.4, there is only Consumption EPS: Your forward nodes are producing logs and not consuming them and so their EPS is 0. |
Beta Was this translation helpful? Give feedback.
-
|
Thanks @dougburks; missed that change. Assume there's no plans of reintroducing the production EPS for the forward nodes? Was using that as the go to for monitoring the health of the forward nodes and dependent TAP infrastructure. |
Beta Was this translation helpful? Give feedback.
-
There are no plans of reintroducing that as it relied on functionality in 2.3 that is no longer present in 2.4.
If you go to SOC Dashboards, the default Overview dashboard has an observer.name table that should show how many logs are coming from each forward node: |

Beta Was this translation helpful? Give feedback.
In 2.3, there were both Production EPS and Consumption EPS:
https://docs.securityonion.net/en/2.3/grid.html
In 2.4, there is only Consumption EPS:
https://docs.securityonion.net/en/2.4/grid.html
Your forward nodes are producing logs and not consuming them and so their EPS is 0.