Creating a dynamic (line) chart from frontmatter for tracking books read #1285
Replies: 2 comments
-
Yes, I think the I think the line graph you want will be much easier in a plugin focused on graphs than one on tables like dataview. Maybe folks on the Obsidian Forums or Discord can help with Tracker or Charts or suggest some other graphing option. |
Beta Was this translation helpful? Give feedback.
-
|
I don't really think this is a dataview question. Can you post a discussion on the Obsidian Charts repo? I could tag phirb0 here but that's rather impolite IMO. |
Beta Was this translation helpful? Give feedback.
Uh oh!
There was an error while loading. Please reload this page.
-
I'm trying to create a tracker for the books I read. I've been using the plugin Tracker for a while, but there seems to be no more progress in it.
I'd like to create a line graph that shows the number of books I've read over the span of a year.
So if I've read 3 books in February, the graph would go up a tick and connect that dot to the dot of January, etc.
The graphs available in the Tracker plugin don't work right, somehow the values get added together, etc.
I've tried playing around with the Charts plugin, but I don't understand it well enough.
On reddit I got this as an answer:
and you get something like this:
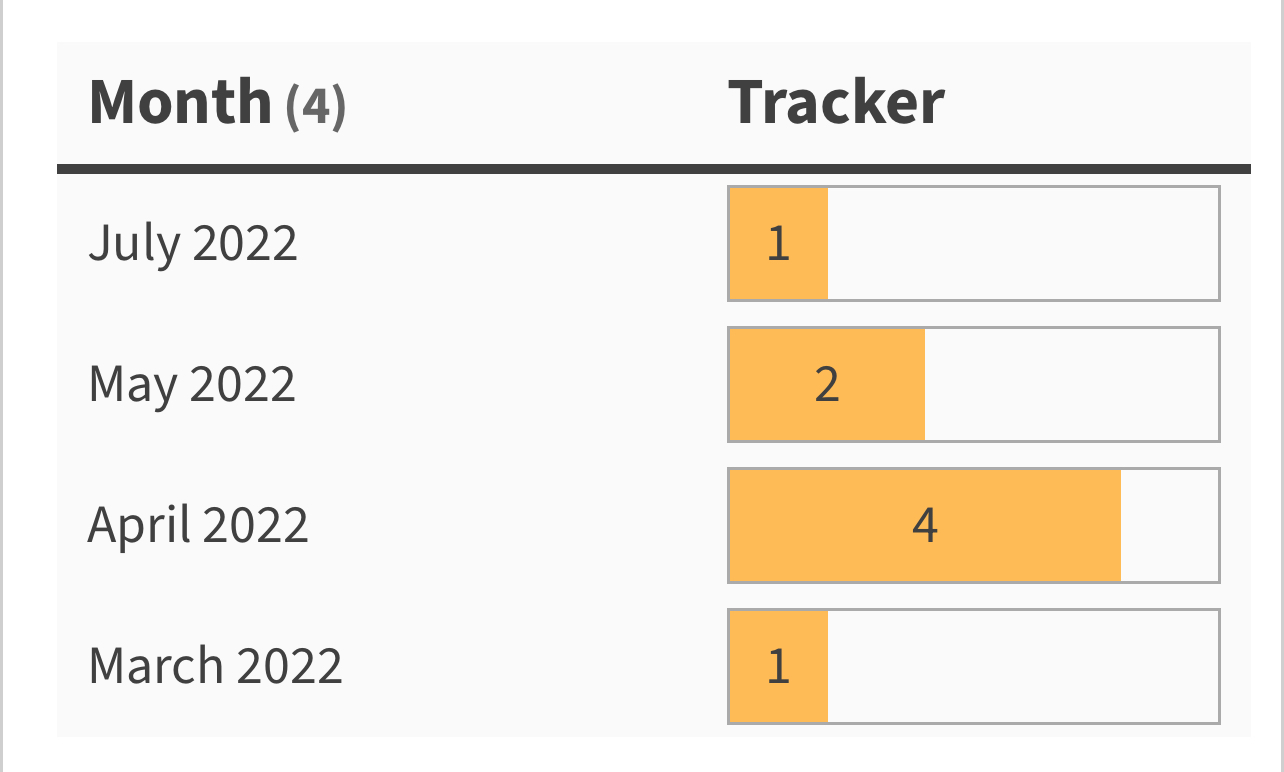
While that's nice, it's not quite what I had in mind. I'd prefer a line chart that continuously goes up as you read more books, so that if you've read 3 books in January, February starts at a value of y = 3 and then adds on to that.
The problem with that bar chart is that it only works (I think) if you have a goal of X books per month. Otherwise the distance that each book advances the bar seems arbitrary to me.
Any pointers or ideas?
Thanks!
Beta Was this translation helpful? Give feedback.
All reactions