Home
The fastest and easiest way to configure TRex is install it locally into VirtualBox. Here is a step by step installation instruction:
- Install VM using this manual
- Configure VM:
- Open VM Settings -> Network -> Advanced -> Port forwarding
- Add VM port forwarding for ports: 4501(async), 4507(scapy-server)
- Update trex:
- Start VM and connect via ssh:
ssh -p 3022 [email protected](password: trex) - Update TRex to the latest release
- Start VM and connect via ssh:
    cd /opt/trex/
    wget --no-cache http://trex-tgn.cisco.com/trex/release/latest
    tar -xzvf latest
- Run TRex server:
(cd /opt/trex/v2.* ; sudo ./t-rex-64 -i )
Since version v2.14 trex-core runs scapy_server automatically on the same host, but on port 4507.
Download latest release from https://github.com/cisco-system-traffic-generator/trex-stateless-gui/releases
You can use Mac/Windows installer (dmg/exe files)
You can find embedded packet editor in a build/edit stream dialogs
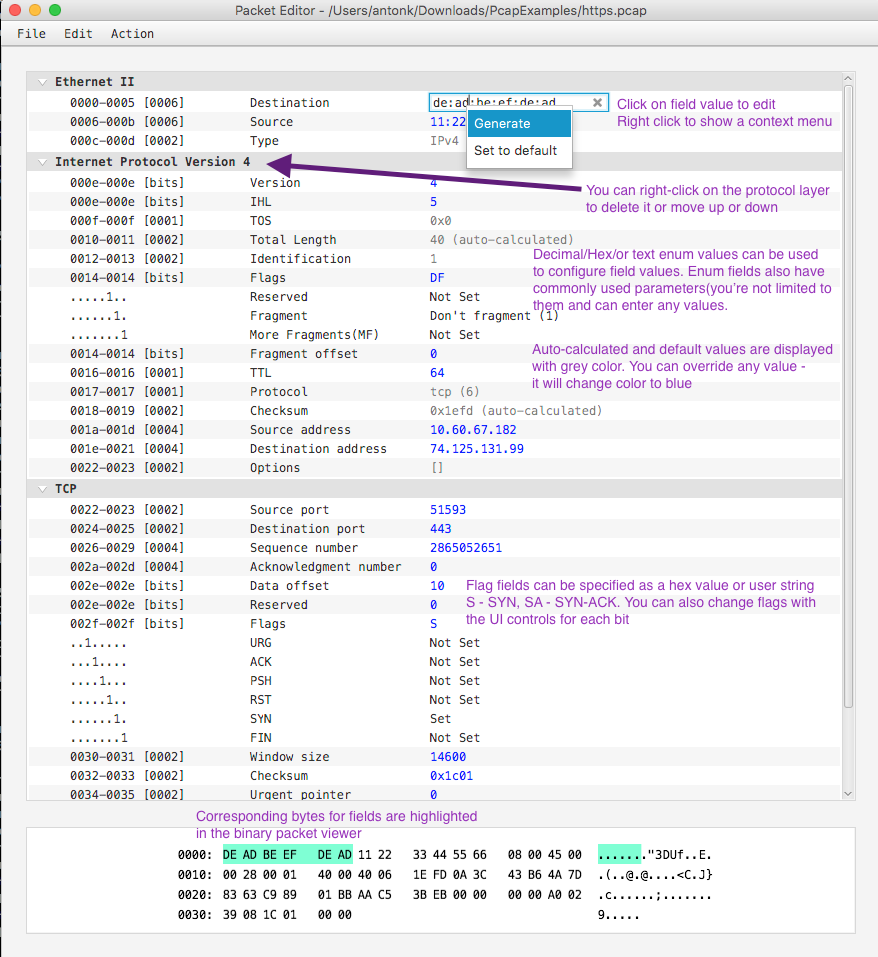
You can select available(suggested) layers, or type any layer you want to produce a malformed structure.
Click on a append field and start typing - autocompletion will show all available variants without restrictions.

Packet editor is flexible and uses Scapy to build packets. It allows to create malformed packets, and shows a warning(red label on a layer name).
You can move and remove any layer(except Ether) by the right-click on the layer title

You can use menu, hotkeys and the toolbar to use the following features:
- create a new packet
- create a new packet from the template
- undo & redo
- import a first packet of the PCAP file
- Export packet to PCAP file or save current packet model to a JSON file

Menu is not available in the embeded mode
Payload generator can append Random or template bytes to any layer You have following options:

Use template-code and specify the target size of a payload of a whole packet you want. Template code is a hex string. Example: "DE AD BE EF F0 0D" (6 bytes will be repeated to fill the target size. all whitespaces are ignored).

You can upload a binary file as a payload

Use "random ascii/bytes" option to generate random payloads of printable characters or any bytes.

At any time you can see the binary representation of a network packet you've created. Click on a field to highlight corresponding packet bytes in a binary viewer


List of supported instructions
- STLVmFlowVar
- STLVmWrFlowVar
- STLVmWrMaskFlowVar
- STLVmFixIpv4
- STLVmTrimPktSize
- STLVmTupleGen
- STLVmFlowVarRepetableRandom
- STLVmFixChecksumHw
Smart autocomplete for instruction parameters. Flow variable names:

Fields' offset names:

Handle protocol duplication. Packet structure widget and offset autocompleter knows when packet contains duplicate protocols and suggest protocol indexes also.

Create predefined instructions template with initial parameter values:


Interactive help for instructions:

It is easy to export parameters from simple configuration mode to Advanced(Packet Editor + Field Engine).


Dashboard is active only if the TRex Stateless GUI connected to the TRex server. You can open it from the Stats menu or by click on the dashboard icon in top-right corner of the main window.

At the top of the dashboard you can see global TRex statistics. Global statistics contains ten panels which represents main TRex statistics. Four of them have an color indicator which is green if value is good and red if it is not. It are "CPU", "Rx CPU", "Drop Rate" and "Queue Full". For the "CPU" and "Rx CPU" a good value threshold is 85%, for the "Drop Rate" and "Queue Full" it is 0.
Ports statistics table represents total information about all selected ports and detail information about each of it. Here is two rows which have color indicator with good value threshold equals to 0. It are oerrors and ierrors.

On the left side of the dashboard you can see the filter panel.
You can filter statistics by selection the port owner(All, My).

Or you can select specific ports.

Streams statistics table represents detail information about active streams.

At the bottom of the filter panel you can specify count of streams which you want to see.

Latency window table represents detail information about the last ten temporary max latencies, jitter, max latency, avg latency and common information about the errors. Errors row has color indicator with good value threshold equals to 0.

Latency window table represents detail information about the latencies and errors. All error rows have color indicator with good value threshold equals to 0.

Charts view represents graphical information about the streams and latencies.

You can choose charts interval.

You can choose layout to see more charts at the same time.

You can click on the chart to select it type.

Clear button provides ability to reset statistics.
