Unable to see activities in Grafana Dashboards #108
Replies: 3 comments 1 reply
-
|
Thanks for checking out the project! Here are my recommendations for troubleshooting grafana:
From there, lmk what you find and I try to continue to troubleshoot. |
Beta Was this translation helpful? Give feedback.
-
|
This boils down to a change at some point in Grafana. There are two ways to fix this:
I'll update the grafana folder to reflect this shortly, sorry I missed this in the last update. |
Beta Was this translation helpful? Give feedback.
-
|
Yes, that fixed it. Thank you. Will try out the platform and report back
any issues.
…On Tue, Aug 16, 2022 at 8:13 AM Dustin Updyke ***@***.***> wrote:
This boils down to a change at some point in Grafana. There are two ways
to fix this:
1. Import the GHOSTS 5 dashboard
<https://github.com/cmu-sei/GHOSTS/blob/master/configuration/grafana/dashboards/GHOSTS-5-default%20Grafana%20dashboard.json>
and use this view.
2. Modify the one you have, by clicking on timeline breakdown and
choosing edit. Then change the last line of the SQL statement to ASC
instead of DESC so that it says order by date_trunc('minute',
createdutc) ASC and click apply and then save.
I'll update the grafana folder to reflect this shortly, sorry I missed
this in the last update.
—
Reply to this email directly, view it on GitHub
<#108 (comment)>,
or unsubscribe
<https://github.com/notifications/unsubscribe-auth/AN4PX6WK6JDOQIL6P6BDN63VZOAWRANCNFSM56TI5HUQ>
.
You are receiving this because you authored the thread.Message ID:
***@***.***>
|
Beta Was this translation helpful? Give feedback.

Uh oh!
There was an error while loading. Please reload this page.
-
I came across GHOSTS platform while searching for Simulated User Behavior. Really like the way GHOSTS platform is architected. I was able to install all Server components API, Postgres and Grafana with out any issues.
I have installed windows client 6.1 ; updated API URLS in application.json and configured Command handler in timeline.json.
When I run he ghosts application on the client i can see the command getting triggered at specified interval. I can see the activities in the log directories. I am unable to see the activities in the Grafana Dashboards. I am not sure if i need to configure anything else. There are no errors in the application.log
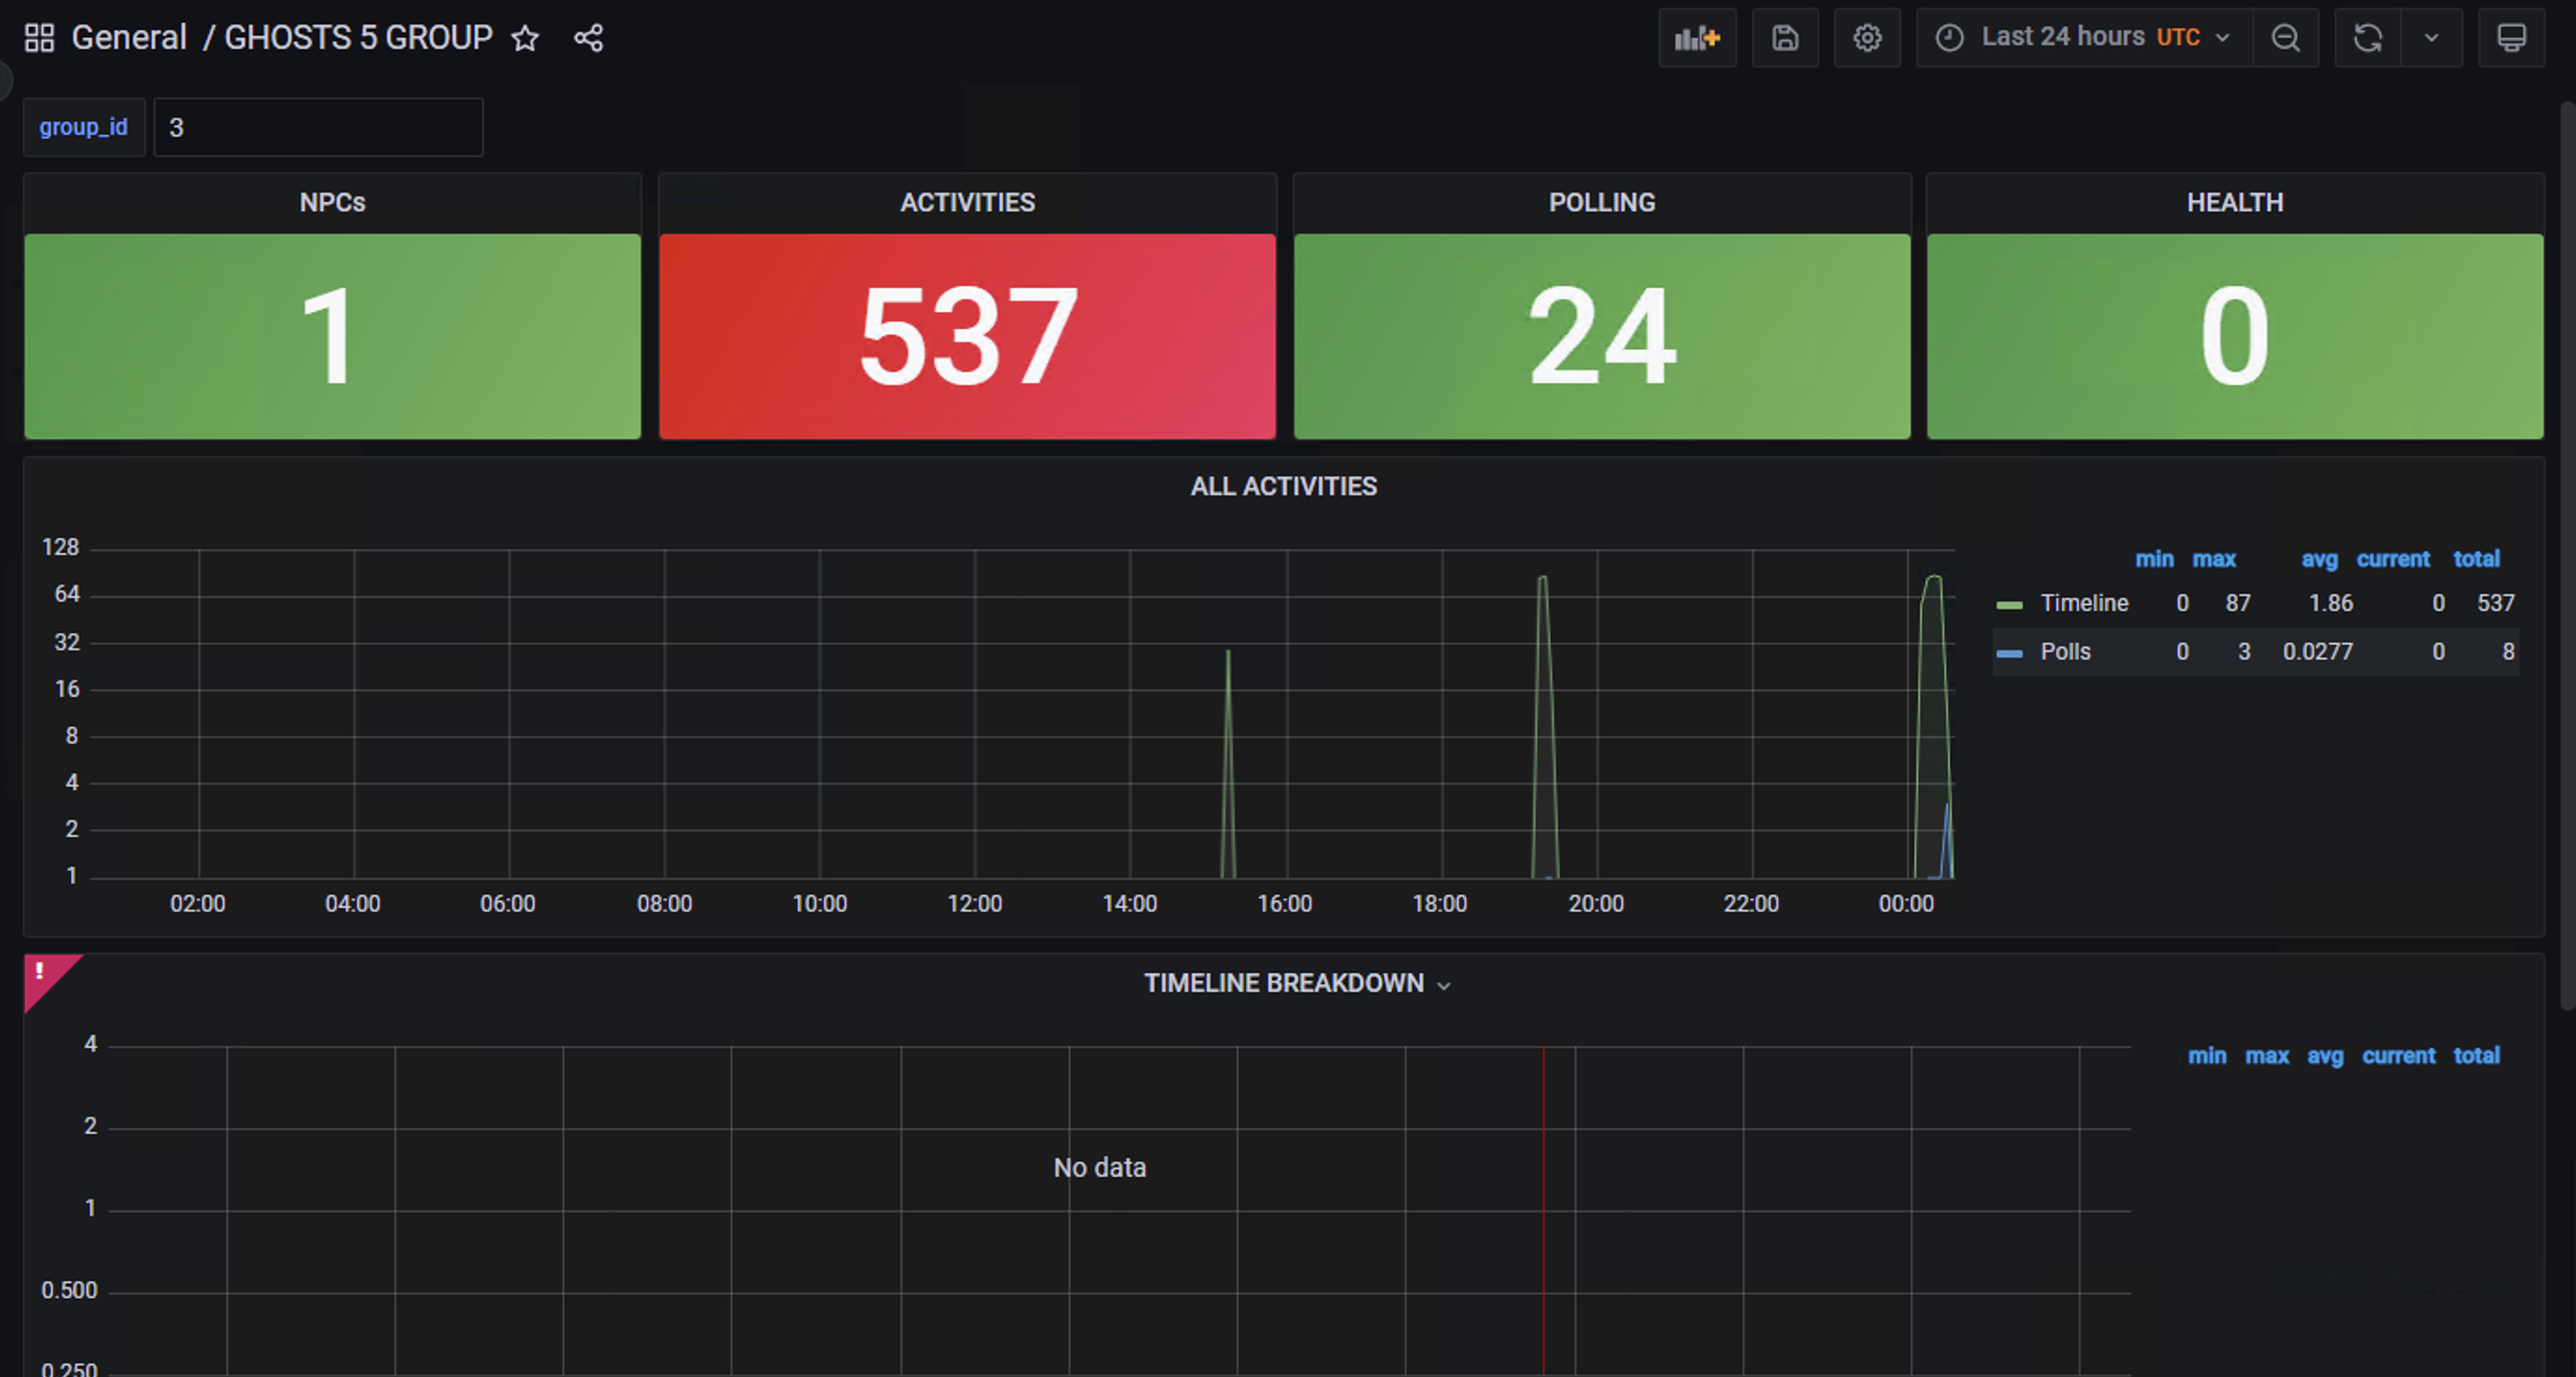
Following is what I am seeing in the Grafana Dashboard

Beta Was this translation helpful? Give feedback.
All reactions