No cells are visualized with plot_cells_3d, as in order_cells #590
Description
From the docs: https://cole-trapnell-lab.github.io/monocle3/docs/trajectories/ I use:
cds_3d <- reduce_dimension(cds, max_components = 3)
cds_3d <- cluster_cells(cds_3d)
cds_3d <- learn_graph(cds_3d)
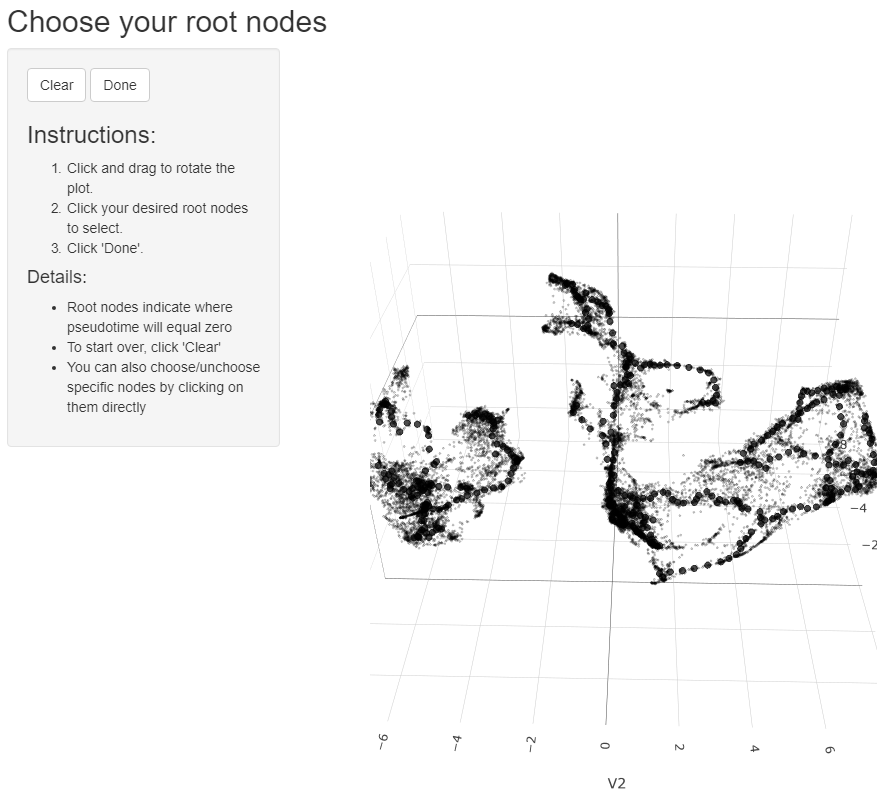
cds_3d <- order_cells(cds_3d, root_pr_nodes=get_earliest_principal_node(cds))
cds_3d_plot_obj <- plot_cells_3d(cds_3d, color_cells_by="partition")
However, with my own root_cells (not shown). The figure I'm obtaining is as follows:
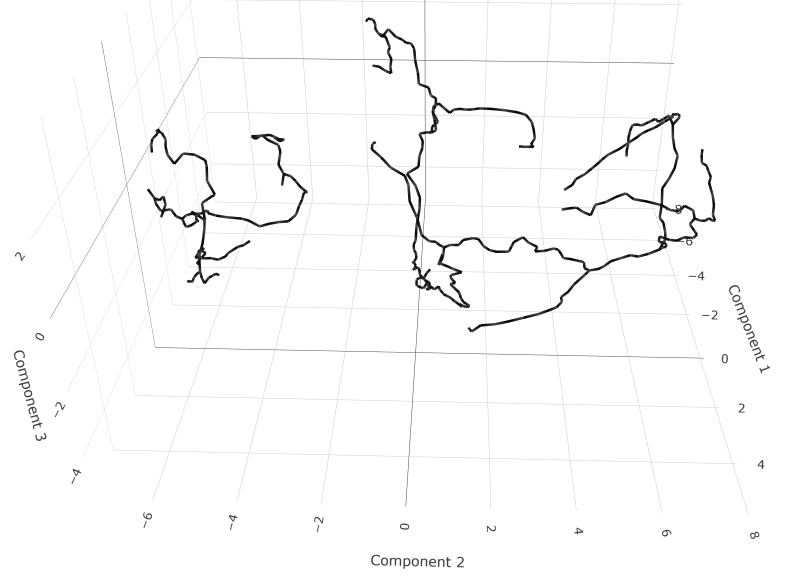
This only shows the trajectory, but I would also like to see the cells, and their clusters (with coloring).
The order_cells function does seem to show cells, is it a bug that plot_cells_3d doesn't?
Happy to provide more info.