Replies: 1 comment 4 replies
-
|
Without the actual file, it is hard to really debug this as there are many potential issues.
|
Beta Was this translation helpful? Give feedback.
-
|
Thank you very much @snowman2 for your useful comment! The data is equally spaced (0.5 degree), although I start from a grid like dataset which has some "holes" that I fill with this: I think the problem might be in the sorting, as you suggested. I normally sort my DataFrame with I also tried sorting directly the xarray DataSet using Do you know how am I supposed to sort my coordinates? |
Beta Was this translation helpful? Give feedback.
-
|
ok, sorry, apparently, I missed that Thank you! Still trying to figure out how to place the coordinates to let QGIS placing my data correctly but I guess I am close to the solution now, but at least PanoPly seems to like them ;)
|
Beta Was this translation helpful? Give feedback.
-
|
hi @umbe1987, did you solve it for QGIS? I am struggling with that for some days already. My |
Beta Was this translation helpful? Give feedback.
-
@leomiquelutti I did not, but at least I am able to use the files within python just nicely. I used QGIS as a means to test whether what I was producing made sense, but apparently QGIS seemed to have an issue in representing (what most likely are) correct NetCDF files. |
Beta Was this translation helpful? Give feedback.
Uh oh!
There was an error while loading. Please reload this page.
-
Hello and first of all thanks for this neat project!
I am currently trying to create a NetCDF with Python and rioxarray that is in EPSG:4326 coordinate system.
This is a sort of alternative to my question already posted on gis.stackexchange.com.
I am starting from a CSV file with
latitude,longitude,timecolumns which I use as dimensions, and other columns which are used as variables.The workflow I am following to create the NetCDF file from the CSV is as follows:
rio.write_grid_mappingrio.write_crsHere is the code I am using:
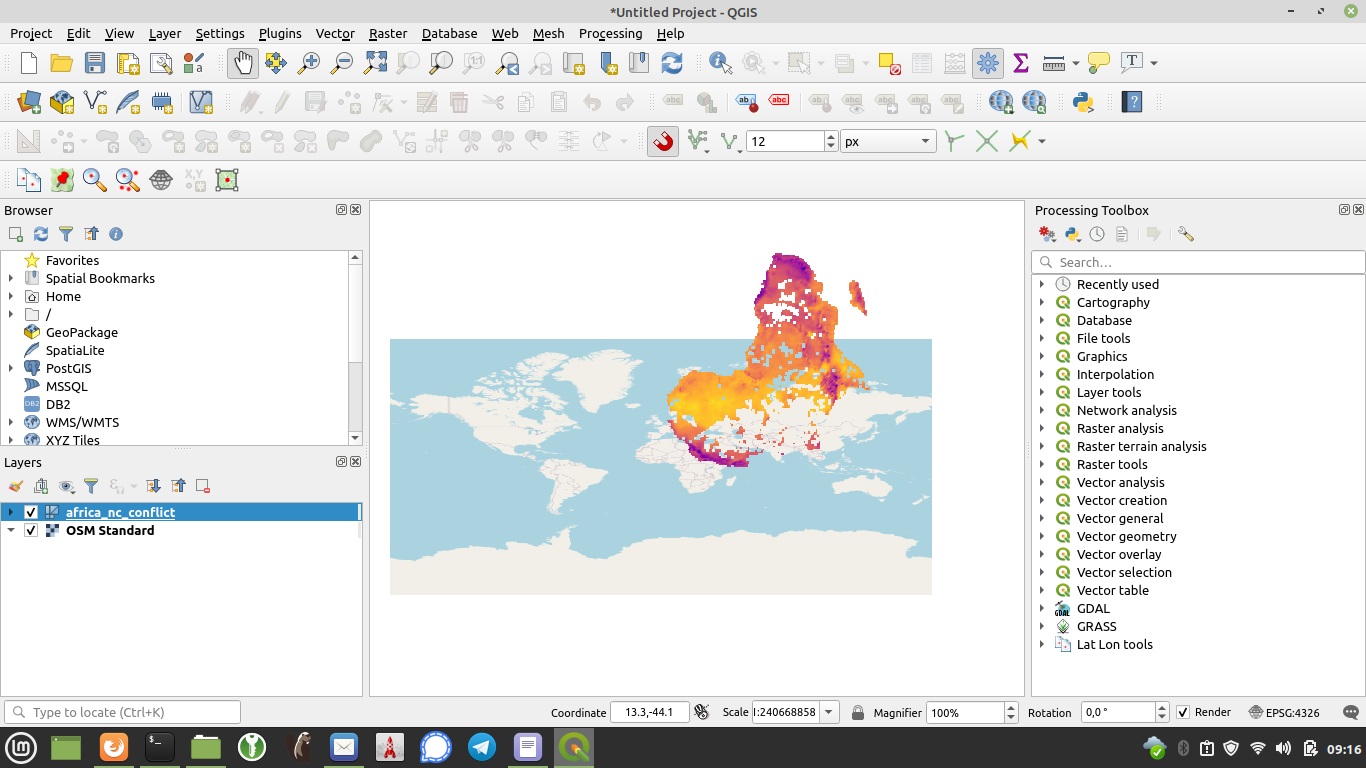
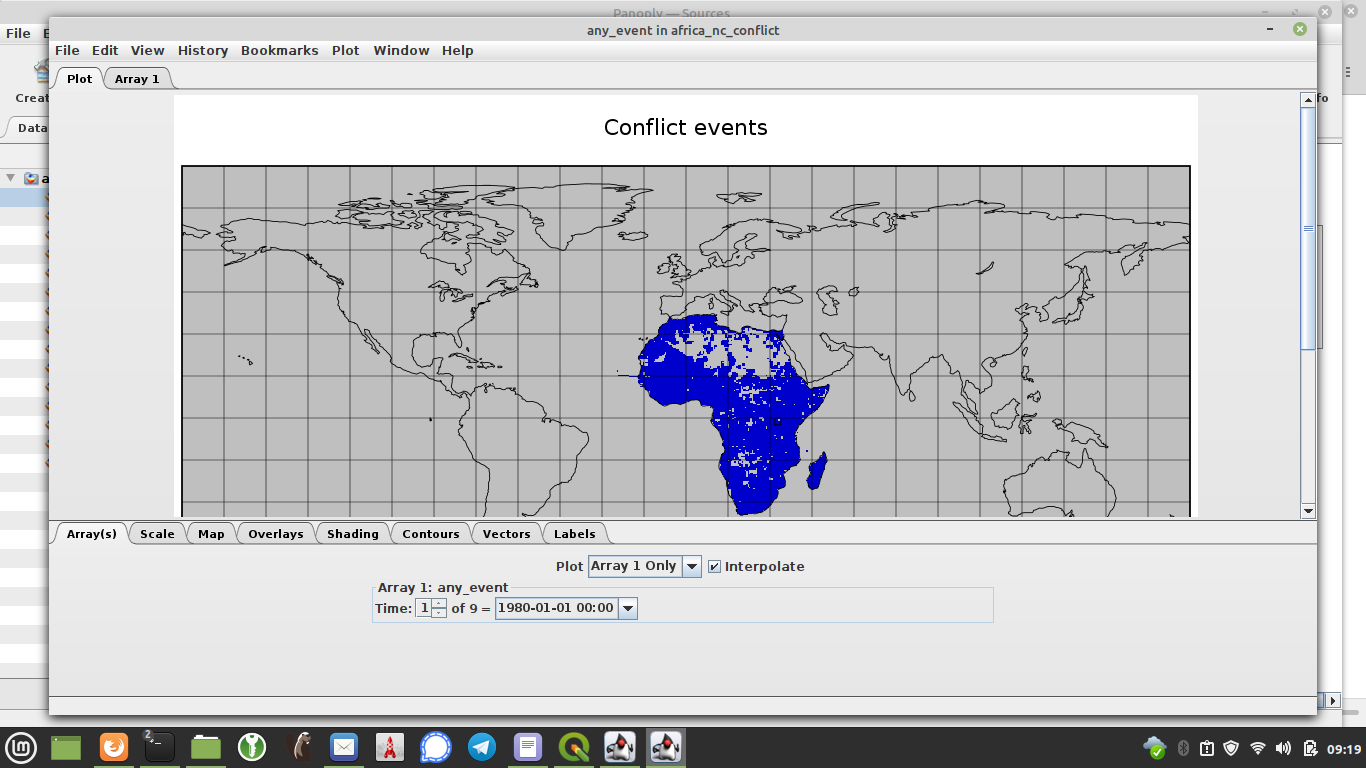
This all seems to write the nc file correctly, except that when I try to visualize it in QGIS or Panoply its content is not displayed in the correct place in the World.
It should cover Africa, while I am getting strange positioning like the ones in the pictures below. I would greatly appreciate any help to solve this issue. Many thanks in advance.
I also insert the info based on Panoply:
Beta Was this translation helpful? Give feedback.
All reactions