Replies: 2 comments
-
|
Just came across similar data of a Viessmann water heating tank, where I even had to create proper timestamps before displaying it in plotly. Raw data were looking like Not sure if this is the most efficient way how to do it (likely not), but it's working pretty well. Full story including instructions on how to setup a dummy plot page with simulated data here, if you don't mind translating from German. Your situation should be easier to handle, as the date is already there in the right format, so the Jinja of the template sensor should be way shorter. Hope this helps pointing you to the right direction, good luck! /tom |
Beta Was this translation helpful? Give feedback.
-
|
Hallo Tom, Deutsch ist wunderbar :-) This is definitely the right way, but I have problem with reading attribute field of this sensor. In Developer Tools => Templates I tried:
but the result is "null": 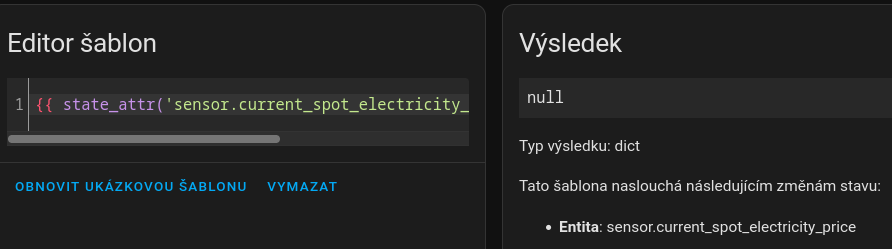
"spot_combined" is my label, there is no such label in the attribute field: 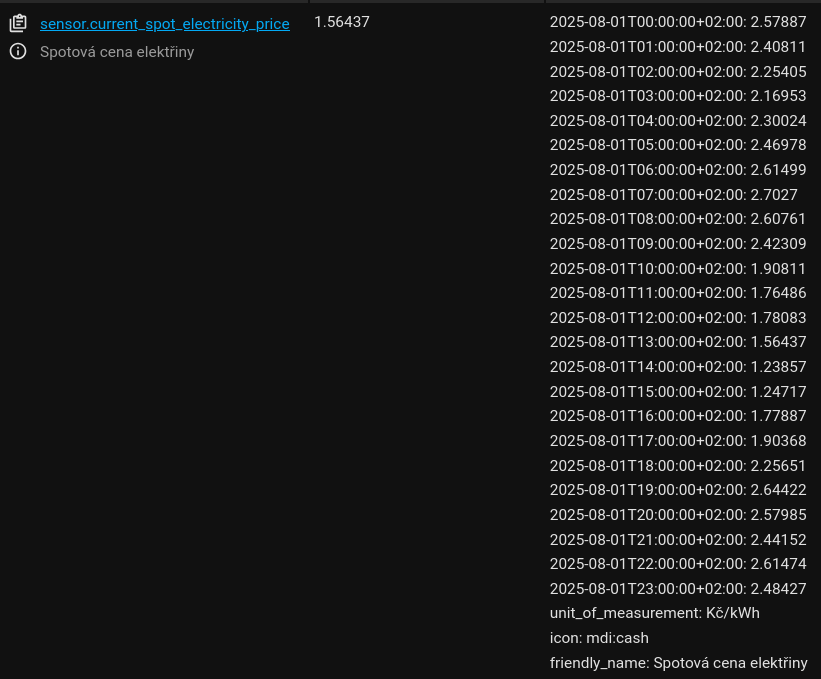
Please don't you know what I'm doing wrong? |
Beta Was this translation helpful? Give feedback.
Uh oh!
There was an error while loading. Please reload this page.
Uh oh!
There was an error while loading. Please reload this page.
-
Hello,
I have following data:
The structure is fixed [date, value] and data are stored in sensor's attribute.
I tried this x, y $ex but doesn't work:
If helps, working apexcharts code is:
Please, do you have any ideas?
Beta Was this translation helpful? Give feedback.
All reactions