-
|
I am new using this fantastic plotly integration and was hoping someone could help me with the issue above. Now I would like to see the daily consumption as a bar graph. I used the code below. Unfortunately this only results in a flat line.
Would appreciate some hints to learn what I am doing wrong. |


Beta Was this translation helpful? Give feedback.
Replies: 5 comments 11 replies
-
|
From here, you probably need to use 'state' instead of max, but we didn't implement that. |
Beta Was this translation helpful? Give feedback.
-
|
Many thanks for your superswift reply and for helping out on this ! |

Beta Was this translation helpful? Give feedback.
-
|
Fixed in v1.4.8! see #93 type: custom:plotly-graph-dev
entities:
- entity: sensor.electricity_total
statistic: state
|

Beta Was this translation helpful? Give feedback.
-
|
BTW, you can do bar charts too, see #28 |
Beta Was this translation helpful? Give feedback.
-
|
Many thanks for helping me out. All is working fine! Just 1 specific issue I can't explain : the current day is shown with 2 bars. Any idea ? Would help me to better understand how all is working.
|

Beta Was this translation helpful? Give feedback.
-
|
I introduced a bug in v1.5.0, I'll make a new release today and ask you to confirm if this issue remains |
Beta Was this translation helpful? Give feedback.
-
|
Hi there, I just updated to version 1.5.3 and to be certain also restarted HA, but the double value still is present. |

Beta Was this translation helpful? Give feedback.
-
|
@Jn115759 stick around, the next version should fix this :) |
Beta Was this translation helpful? Give feedback.
-
|
I can't get why the bar chart shows a lower value on Nov 8 

Tried different filters, and none can show a real number. Can only show "bar" with true values like this: 
|
Beta Was this translation helpful? Give feedback.
-
|
I guess you need to include period: day and filters: - delta: 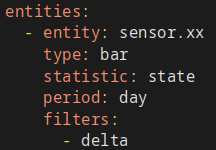
|
Beta Was this translation helpful? Give feedback.
-
|
You could try the integration filter |
Beta Was this translation helpful? Give feedback.
-
It's already that way with template sensors: inverter battery power usage sensor -> integration sensor -> utility meter So I only wanted to show peaks of battery consumption over time, to know when the last time it was discharged more than usual and how often. |
Beta Was this translation helpful? Give feedback.
-
|
For peaks you could use the max statistic |
Beta Was this translation helpful? Give feedback.
-
It works pretty weirdly, not showing half of the records. 
Max | Min | State 
Code: Code is the same, only statistics method changestitle: sensor.invertor_discharging_kwh_2
type: custom:plotly-graph
entities:
- entity: sensor.invertor_discharging_kwh_2
statistic: max
period: day
type: bar
texttemplate: "%{y:0.1f}"
filters:
- filter: i>=1
hours_to_show: 14d
refresh_interval: 60
grid_options:
columns: full
layout:
dragmode: pan
height: 350
margin:
b: 90
legend:
itemwidth: 50
xaxis:
rangeselector:
"y": "-.3"
buttons:
- count: 1
step: day
- count: 2
step: day
- count: 7
step: day
- count: 14
step: day
- count: 30
step: day
- count: 90
step: day
config:
scrollZoom: true
doubleClickDelay: 600Oh, there is also a DT problem, for cases when the battery is discharging during the night, 23:59 till the next day 00:01. It's not the ultimate issue, but could I build the graph like that? For example:
Ideally, bars should indicate maximum battery discharge for n periods of blackouts (not counting days, but blackouts between zero values) |
Beta Was this translation helpful? Give feedback.
-
|
I'd suggest setting the period to day. entity: sensor.xxx
filters:
- map_y: 'y > ys[i+1] || i === ys.length ? y : null'
- force_numeric |
Beta Was this translation helpful? Give feedback.
Fixed in v1.4.8! see #93