Sgvizler is a javascript wrapper for easy visualisation of SPARQL result sets.
See http://mgskjaeveland.github.io/sgvizler/ for how to set up, use, and extend Sgvizler, including documentation, downloads, and examples.
Add visualisations directly into your webpages like this:
<div id="example"
data-sgvizler-endpoint="http://sws.ifi.uio.no/sparql/npd"
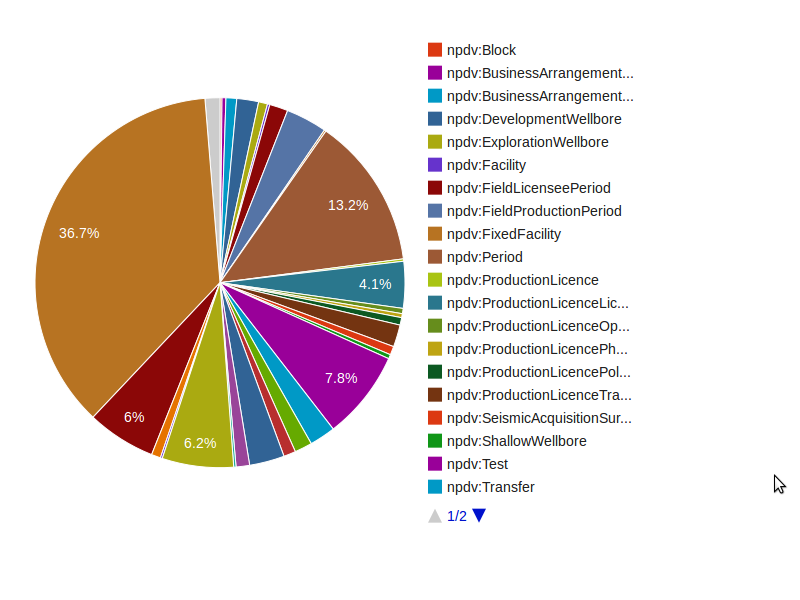
data-sgvizler-query="SELECT ?class (count(?instance) AS ?noOfInstances)
WHERE{ ?instance a ?class }
GROUP BY ?class
ORDER BY ?class"
data-sgvizler-chart="google.visualization.PieChart"
style="width:800px; height:400px;"></div>to get charts like this: