Replies: 3 comments 3 replies
-
|
The launch config of VSCode has several entries, the first one is for the extension that runs per default on hitting F5. The second is for attaching to the language server. Just run it as the second process and you will be able to debug your validator. It is always a good idea to test end to end, but I recommend to also add tests, so that you do not have to take this large feedback loop :). |
Beta Was this translation helpful? Give feedback.
-
|
I agree with tests, but we're early stages just trying to get things going. How exactly do we launch the second part? Might be nice for us to add this into the Getting Started guide. |
Beta Was this translation helpful? Give feedback.
-
|
Just as you launch any debug config in vscode. The yeoman generator automatically adds the |
Beta Was this translation helpful? Give feedback.
-
|
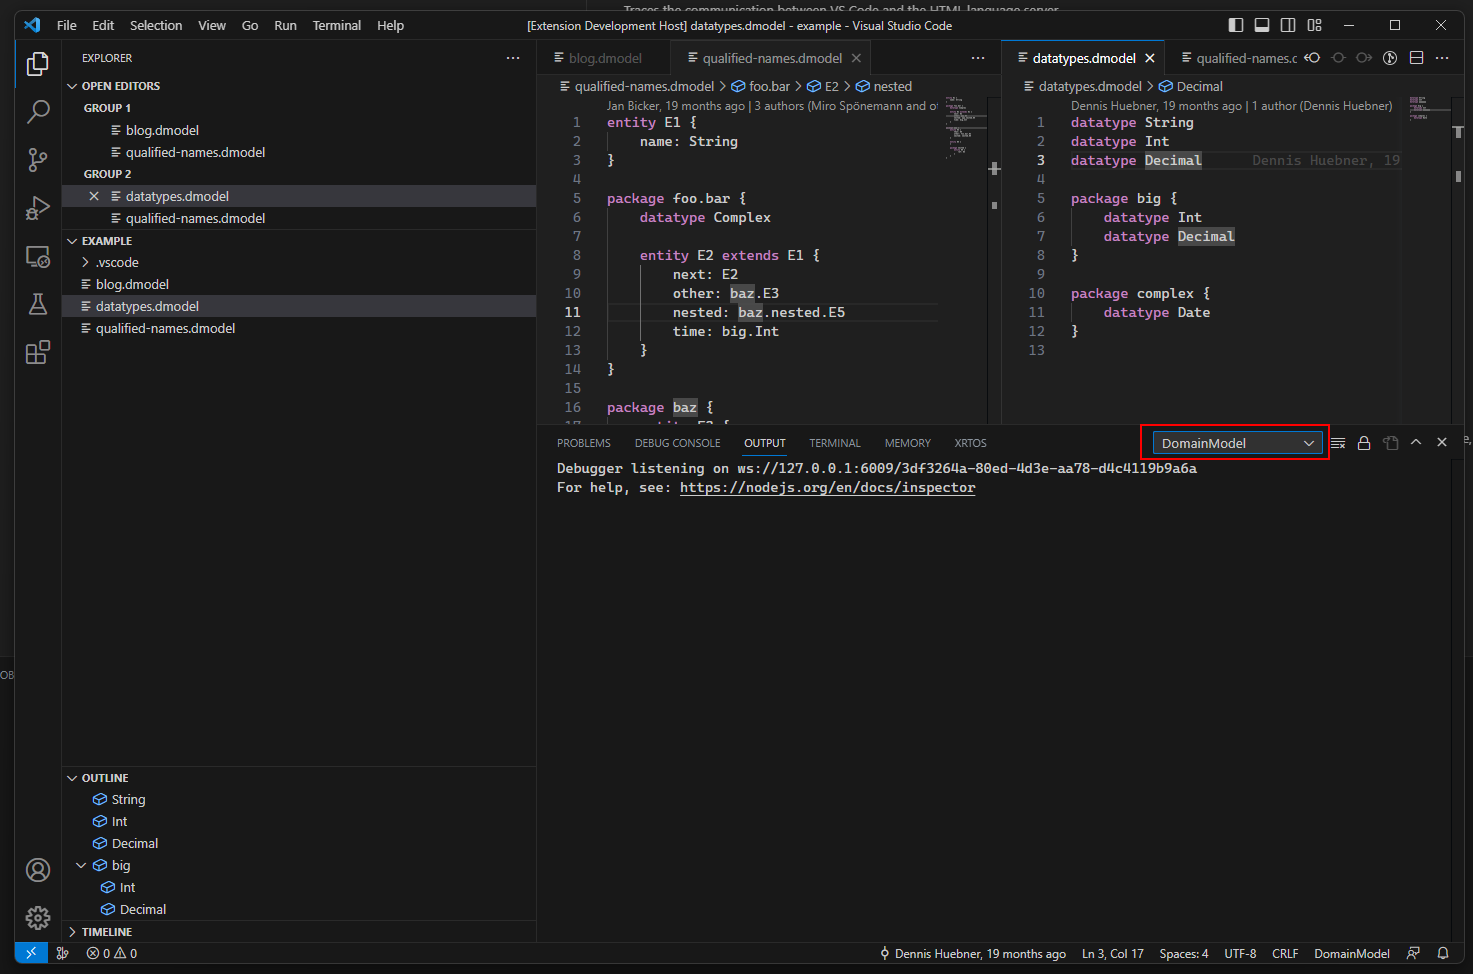
In addition to what @Lotes said (which is very helpful for debugging), console logs from the language server appear in the output panel of the vscode instance that runs your extension. You need to select the corresponding output channel first. See:
|
Beta Was this translation helpful? Give feedback.
-
|
Nice. Thank you both @Lotes @msujew! I'll try both approaches for a spin, and can recommend some text for the guide. |
Beta Was this translation helpful? Give feedback.
-
|
You probably want tsc watch running or at least to a fresh build before starting to debug. Out of date source maps are never fun. |
Beta Was this translation helpful? Give feedback.
Uh oh!
There was an error while loading. Please reload this page.
Uh oh!
There was an error while loading. Please reload this page.
-
I've put
console.logs in my validator. No idea where that output is showing when I hitF5to test. I don't see anything inDEBUG CONSOLE.Beta Was this translation helpful? Give feedback.
All reactions