New to Bangle.js and Espruino. Need help with graphics #5873
Replies: 1 comment
-
|
Posted at 2020-11-21 by @allObjects Ar1: Multiple ways to do that: a filled polygon or two filled circles and a filled polygon... Think of composition. PS: You can study some code at https://www.espruino.com/ui - where mainly the composition concept is used: drawing one simple shape over another simple one renders usually faster than otherwise. This UI stuff was developed for 1 bit serial display. BangleJS has 8bit serial display, so it will render faster already from the get go. Posted at 2020-11-21 by NewAtEspruino Thank you very much! I shall definitely go through the link for UI code you shared. And this following qn. is out of my personal curiosity to know if I am the only one who is finding this a little difficult to code=> I have worked in Javascript and web technologies earlier and I find this coding very different from what I worked on. Is it because that's HTML and web browser that I was working on and here I need to do things differently because its a smart watch?. Even getting a simple icon on the face of the watch is so different. I tried using fonts too, however they didn't work and I didn't find any proper info on how to make them work. It kept saying that it didn't find this font, but I have no clue as to which module needs to be added. I don't have the bangle device and am using the emulator. Setting fonts otherwise in normal Javascript is so easy. Thanks a lot once again for answering my questions. Posted at 2020-11-21 by NewAtEspruino Hi, Posted at 2020-11-22 by @allObjects Great combination... looking good! You can right away use You can simplify by:
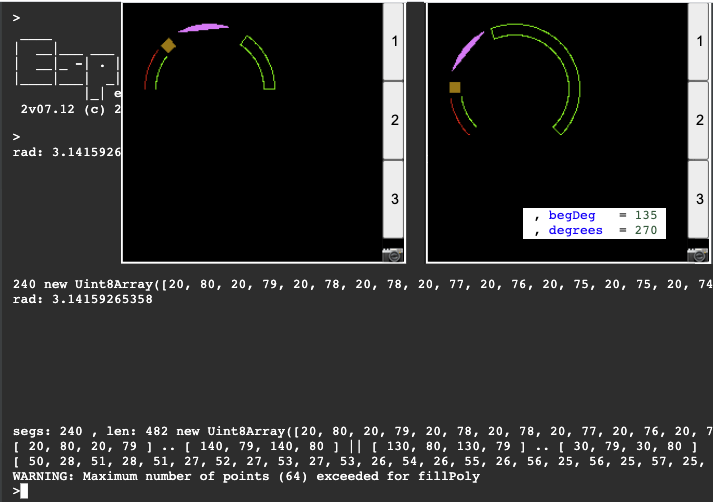
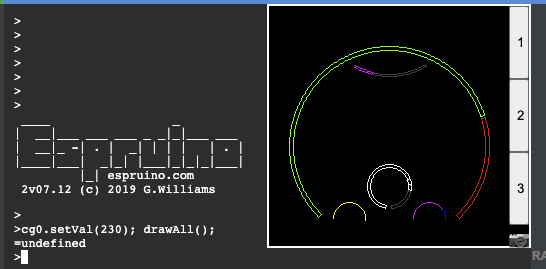
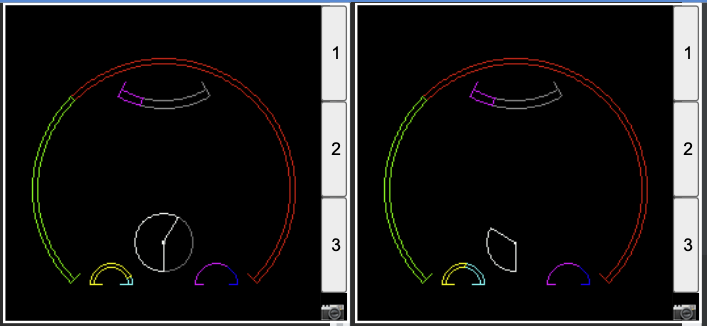
For filling a wedge you need only to calculate half the number of 'circle-points'. For calculation the points on the (outer) circle, use the trigonometric functions Since there is no anti-aliasing, you can put rounded values into the array, which you may calculate a bit different: you take y and calc x (rounded) for half a quadrant and mirror the other three (3) quadrants. When it comes to drawing, you calculate how much of the pre-calculated array you have to use for the polygon. Besides @gfwilliams, I know that @jumjum and @MaBecker have worked on circles and ellipses and stroke with. Posted at 2020-11-22 by NewAtEspruino Thank you so much for all the detailed information. Have a good Sunday evening! Posted at 2020-11-23 by @gfwilliams This might do the kind of thing you're after. By drawing just the poly (rather than using circles) you can avoid some flicker on the Bangle's unbuffered screen... It's a good thing to try yourself though if you're interested - it's not that hard to use sin and cos and once you've got the hang of it it's really useful for a bunch of stuff Posted at 2020-11-23 by NewAtEspruino Hi, Posted at 2020-11-23 by @allObjects Did play around with a mixed approach: pre calc the points for a polygon composed of arrays of points for outer and inner arc. The resolution is optimized towards the radius... which then obviously breaks the Noticed furthermore: Passing an array of odd numbers of values to This is the code. To draw a segment for a particular value range, picks the vertices sets from the outer and inner arc and concatenates them to a single array of vertices by which the polygon is drawn (or filled). The shot shows two sets of data... The gauge is (will be) defined by starting point in degrees and arc in degrees; latter can range up to 360 degrees. The first gage starts at 180 degrees for 180 degrees (clockwise), with the green polygon being Will most likely return to overlays... (not speed optimal, but less impacted by .fillPoly()'s limitation. Segmentation of an arc is though still needed... With precalculation and limited resolution the drawing may become a bit complex... so dropping precalculation is an option (calculate on the fly is obviously not a performance issue... is it?) Attachments: Posted at 2020-11-23 by @MaBecker @allObjects are you aware of Graphics.quadraticBezier() implementation? Posted at 2020-11-24 by @allObjects @MaBecker, heard about... --- Had some fun as you see in the next post. Since the Posted at 2020-11-24 by @allObjects @bppattan, burnt some COVID-19 lockdown oil... and had fun. So far I played in the emulation only and have therefore no feel for performance yet. The The filling of a 'fatt circle' is still to do (and some other stuff as well, as mentioned in previous post, and the already intended 0-tick/zero-tick/-marker at Load the code into the emulation, run it and click the buttons 1..3 or enter value changes in the console as shown in attached screenshot. The The code with usage examples is in the next post. Attachments: Posted at 2020-11-24 by @allObjects Updated: Most recent code of 2020-11-27 in post #26. - Code version here is kept for preserving line numbers used in posts up to #26. CGauge code with examples: For the initial work, I precalculated the vertices and then stringed together the ones I needed, but it got me quickly out of memory, because slicing (and concatenating) of Uint8Arrays creates regular arrays and wastes a lot of RAM. I could go for some crazy compiled C- as described in this conversation about Efficiently moving things around in zig-zag Graphics buffer visualized w/ 24/32 bpp displays / neopixel strings or even worse using some inline Assembler - but it would still be a memory challenge with multiple simultaneous gauges. So I calculate for every draw just what I need in graphic precision (resolution) and memory optimized way. The code can be sped up by increasing the If you want to use the code on displays where calculated vertices - x or y coordinates - will be larger than 255, set the Outlook: As mentioned, there is still room for improvement / enhancements... last but not least, this base prototype/'class' can be wrapped and used with drawing the 0-tick at ```deg0''' position and more 'ticks'/min/max/overshoot/labels and even for a multi segment display gauge. Posted at 2020-11-24 by @MaBecker Wow - that’s amazing! Posted at 2020-11-24 by @allObjects Made some changes to the code in post #13:
Enter Next is to see how it works on a BangleJS. Attachments: Posted at 2020-11-24 by NewAtEspruino woah!!..that's brilliant! Thank you so much. Posted at 2020-11-25 by @allObjects @bppattanEspruino, urvw. Reading (almost any) code is the best way to learn! Since BangleJS and JS by nature run on little resources, makse finding a solution even more interesting. Btw, run it on a BangleJS and it behaves pretty decent. To use the CGauge prototype/'class' in your code, just copy the lines from In your level 0 - global space - you add a variable like: In your initialization code you add something like that: Among the code where you (periodically) update the display - render the values to the graphics display
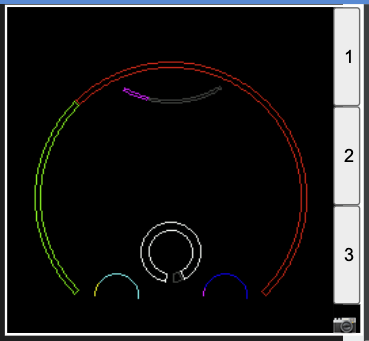
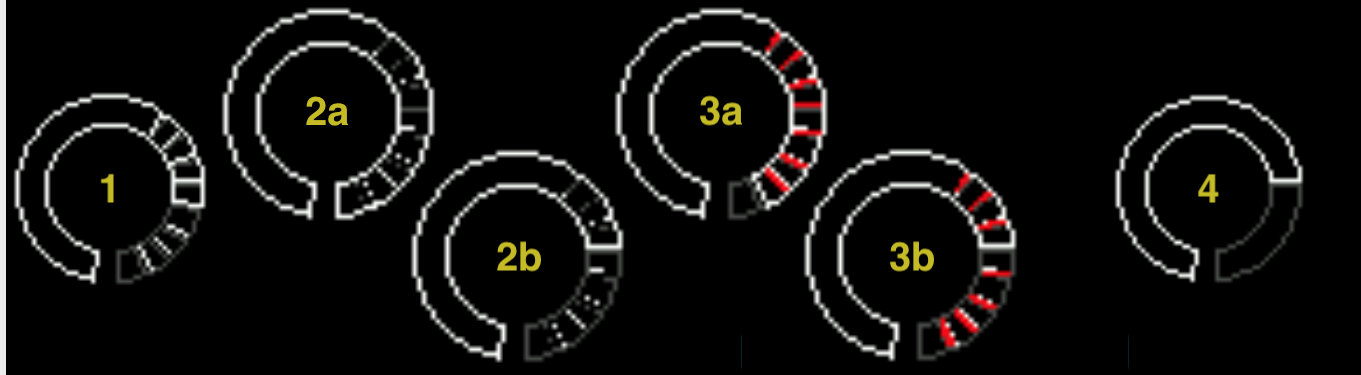
Now - obviously having messed with your assignment - you do not get off for free... :O - LOL...: try to add something to it, for example - in addition to the drawing the outline of the polygon for the value and filler segment, fill the segment value. As you are aware of that only 64 points can be passed to Posted at 2020-11-25 by NewAtEspruino :) Posted at 2020-11-26 by @MaBecker @allObjects have a look and check drawLineAA and drawPolyAA for antialiased line drawing https://github.com/espruino/Espruino/search?q=antialiased @gfwilliams can you update the emulator so we can try this cool feature? Posted at 2020-11-26 by @gfwilliams They're in there already - for instance try: https://www.espruino.com/ide/emulator.html?code=for%20(i=0;i%3C240;i+=10)g.drawLineAA(0,i,240-i,0);&upload I think the emulator may be missing a few rendering tweaks, but on the whole it's all available. Posted at 2020-11-26 by @MaBecker Wow - that's super nice! Attachments: Posted at 2020-11-26 by @allObjects My latest addition to the code in post #13 were line 80, 90 and 110. They are relevant for removing / cleaning up the traverse lines - or 'ladder step' - that go from the outer to the inner arc when redrawing the outlining of a 'fat' gauge with a different value. You can see them in picture of post #12 - the white 'fat' gauge - where the cleanup was not in place yet. When calculating the outline, the clean-Up property
That they are working show the pictures of post #15. Why do I mention this after the recent posts #19 thru #21: Rendering - outlining and proper filling - has still it's issues: initially I used the 4 points to fill a polygon with the (black) background color... which was pretty disappointing, because it did not 'remove' -the ladders completely. I'm not complaining at all. Having a clean, fully symmetric and completely filled polygon is is no easy task. I noticed this earlier when trying to draw round and bevelled shapes on PixlJS. Math-wise it should not make a difference... but with finite size of a line and low resolution all kinds of numeric effects creep in. Attachments: Posted at 2020-11-26 by NewAtEspruino I didn't understand much, however, thanks a lot! :) Posted at 2020-11-26 by @allObjects to illustrate a bit more in detail my findings in #22 (zoom in a bit to see the dark grey better):
Attachments: Posted at 2020-11-27 by @gfwilliams Hi - yes, this is something that came up before with your UI code, and after making some changes to fillPoly at that point I unfortunately ended up having to revert to a more standard polygon fill implementation to make vector fonts work correctly (otherwise the ended up getting filled in when they were small). It seems like a pretty normal thing to have to do with polygon fills. Basically: If you're drawing a polygon between point ABC, and another between BCD, you don't want to be drawing the pixels along the line BC twice - and to do that the main way is to not completely cover one side of the poly. It's actually documented in the fillPoly reference: http://www.espruino.com/Reference#l_Graphics_fillPoly
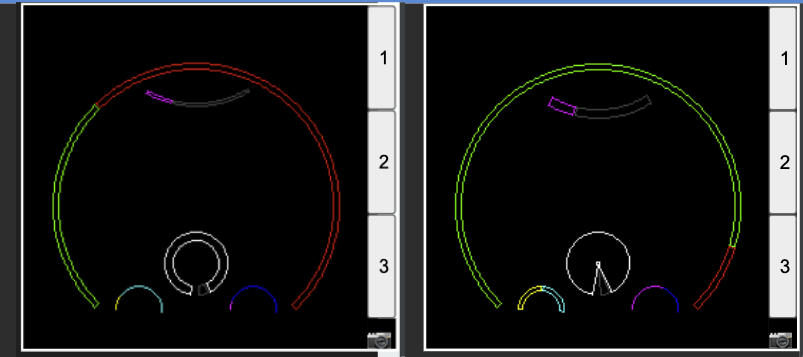
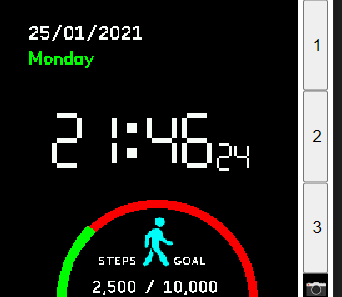
Posted at 2020-11-27 by @allObjects Updated CGauge prototype/'class' which shows begin-tick, end-tick and - if defined - 0-tick. Code in post #13 is left alone to preserve line numbers used in text of past posts. Temporary, updated code also included the option to draw only the value-arg... but it became pretty quickly complicated to render cleanly. Choosing the (black) background color for the fill color yields the same look, just less efficiently ... :< Screenshots attached. This will it be for a while... the filling can wait... Attachments: Posted at 2020-11-27 by @allObjects me keeping going on on this subject does not mean you have to get distracted from your priorities. For me, this conversation became some personal exploring of the problem and possible solution space (and next UI component after having done the vertical/horizontal bar / slider as UI component in UI Framework for microcontrollers... Looks like I have to add the same visuals to those pages as are available in the conversation covering the first comprehensive documentation of Modular and extensible UI framework and ui elements. ). Posted at 2020-11-27 by NewAtEspruino Thanks a lot! Posted at 2020-11-30 by @allObjects Used CGauge in a watch face example: Swiss Federal Railway Clock modeled w/ Circular Gauges. Posted at 2021-01-25 by NewAtEspruino Hello All, I went through this entire thread once again. And looks like there is a lot that has been experimented. Thanks a lot once again! Attachments: Posted at 2023-05-02 by @allObjects Nice, clean layout. Posted at 2023-05-03 by @MaBecker Cool, maybe you could use scaled fixed font for date and day rather than vector. Posted at 2023-05-03 by HughB I built the daisy clock. To get a decent looking ring I did it with a series of fixed images. The resolution of the screen is too course to get non pixellated curves drawn. We really need a 360x360 screen. Posted at 2023-05-04 by @halemmerich After 2 years, @NewAtEspruino might not be new at espruino anymore :) As for drawing rings, there is now a Posted at 2023-05-04 by @MaBecker Nice! Posted at 2023-05-04 by @gfwilliams Yes, the module is at https://github.com/espruino/BangleApps/blob/master/modules/graphics_utils.js Well, realistically if there were to be a fillArc function internally it'd be best to do it with something a bit more clever (like some kind of bresenham thing). If someone wanted to contribute it I'd merge though (albeit probably only on devices that weren't too constrained). The nice thing about the library is if it ever does get implemented we can just make the library use the internal version instead |

Beta Was this translation helpful? Give feedback.
Uh oh!
There was an error while loading. Please reload this page.
-
Posted at 2020-11-21 by NewAtEspruino
Hello,
I am new to Bangles.js and Espruino and still learning the basic know-hows of it.
I do have a background of Javascript coding, however never worked with Graphics.
Sorry, if my questions are very basic. However, after searching a lot over the internet (didn't find a lot of information on coding in this environment), I finally decided to post it here.
I want to show progress of the steps walked using a progress bar or a circle.
However, I don't understand how to implement it.
I need to have a thick bordered circle with some color to show the progress.
OR a rectangular bar that shows the progress.
Right now the data is static and am really not counting the real steps.
So the data in my circle or a bar would not be changing either.
My question is ,
Qn1 : How do I create a circle with a thick border?
Qn2: how do I fill the bar with some color or the thick circle border with some color?
Thanks a lot!
Beta Was this translation helpful? Give feedback.
All reactions