visualizing spans in a notebook displacy.serve vs displacy.render #11305
-
|
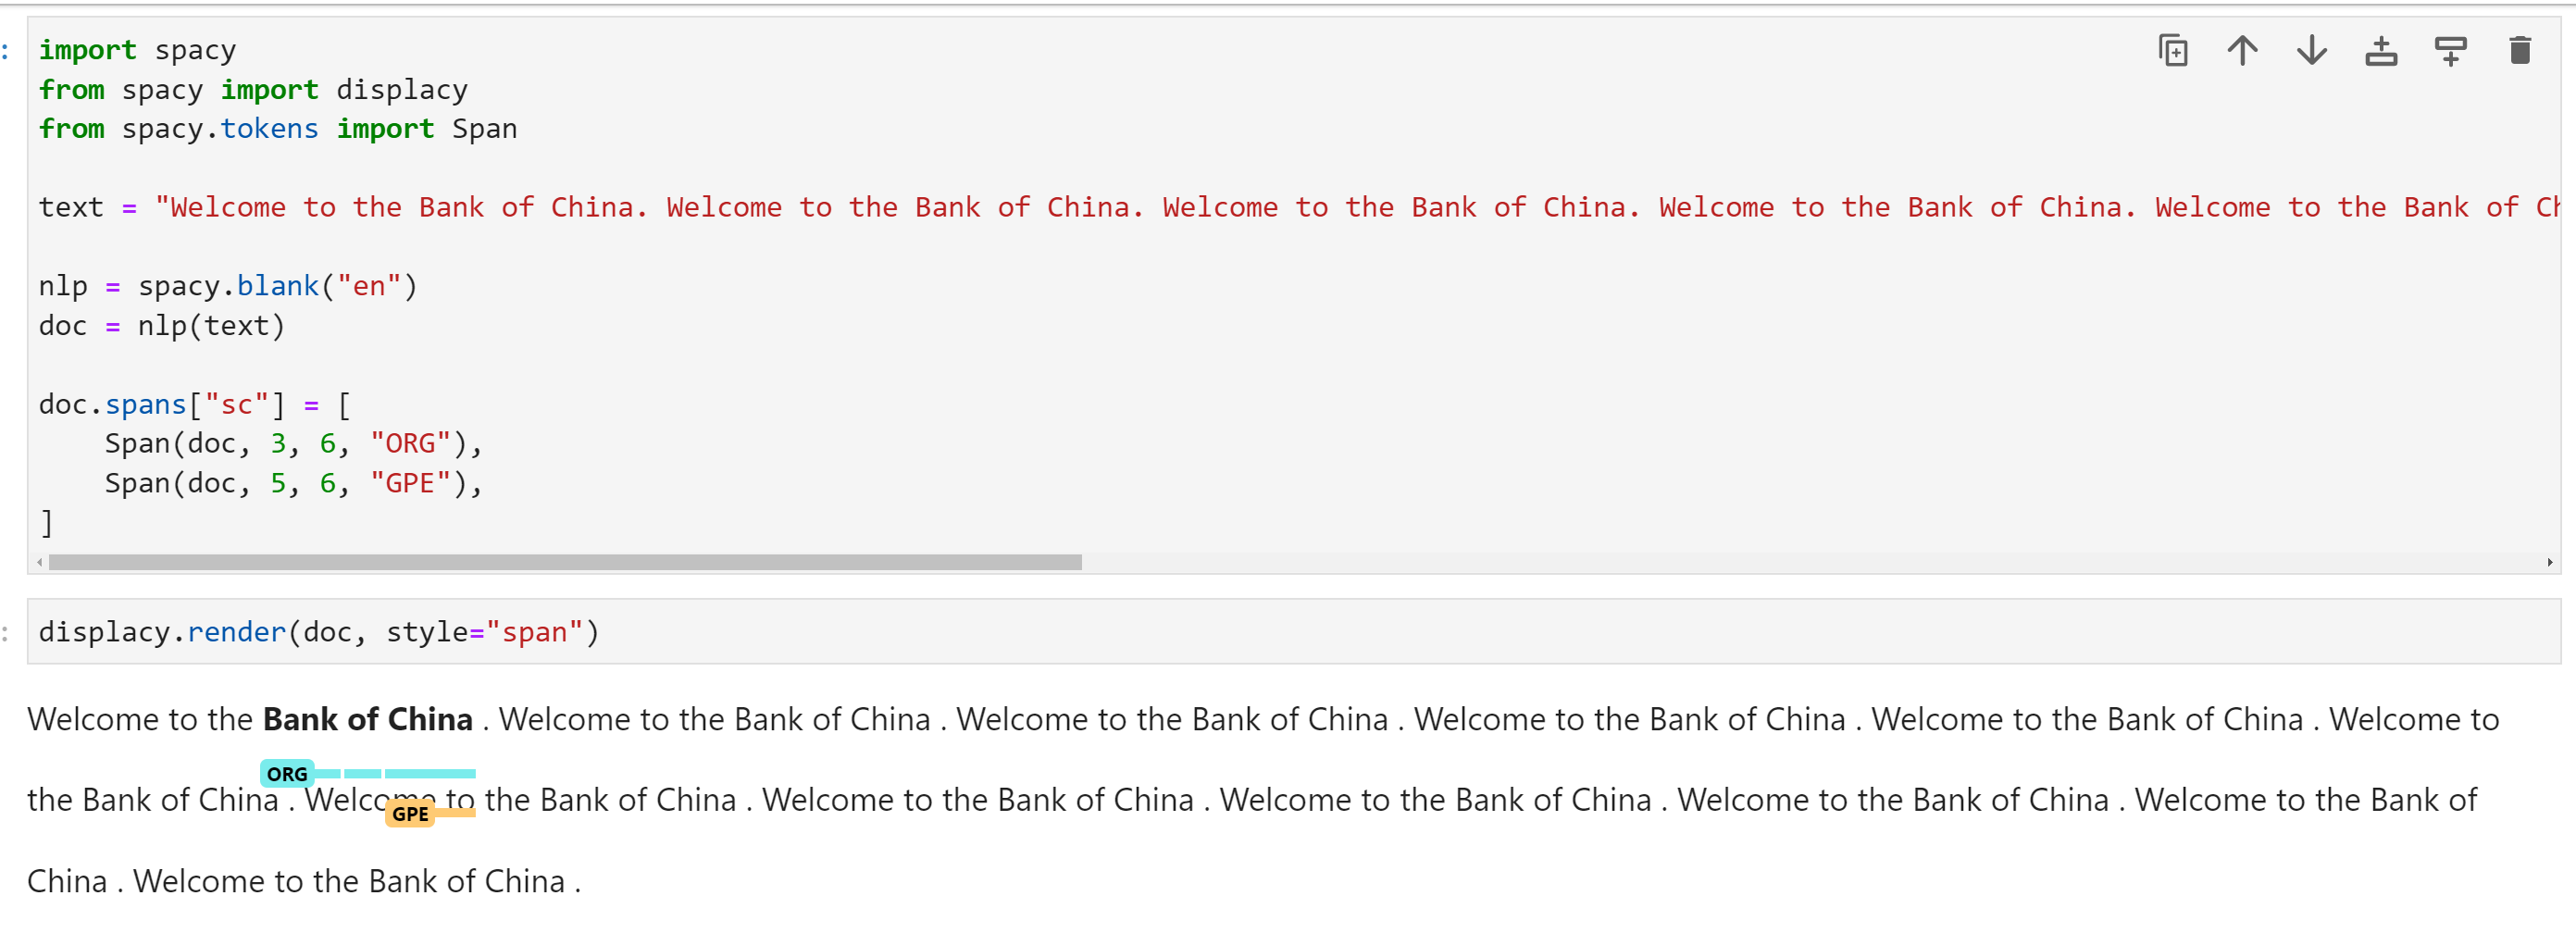
I am following the instructions of spacy in order to visualize the spans in a notebook and copying the code : https://spacy.io/usage/visualizers#span the result in my notebook is as follows: it is weird that when using displacy.render the rendering is of another quality as when using "serve". Serve can not be used properly in a notebook. I would like to know what I need to do to get the result shown in the documentation within a notebook. That means, the underlying. |

Beta Was this translation helpful? Give feedback.
Replies: 1 comment 6 replies
-
|
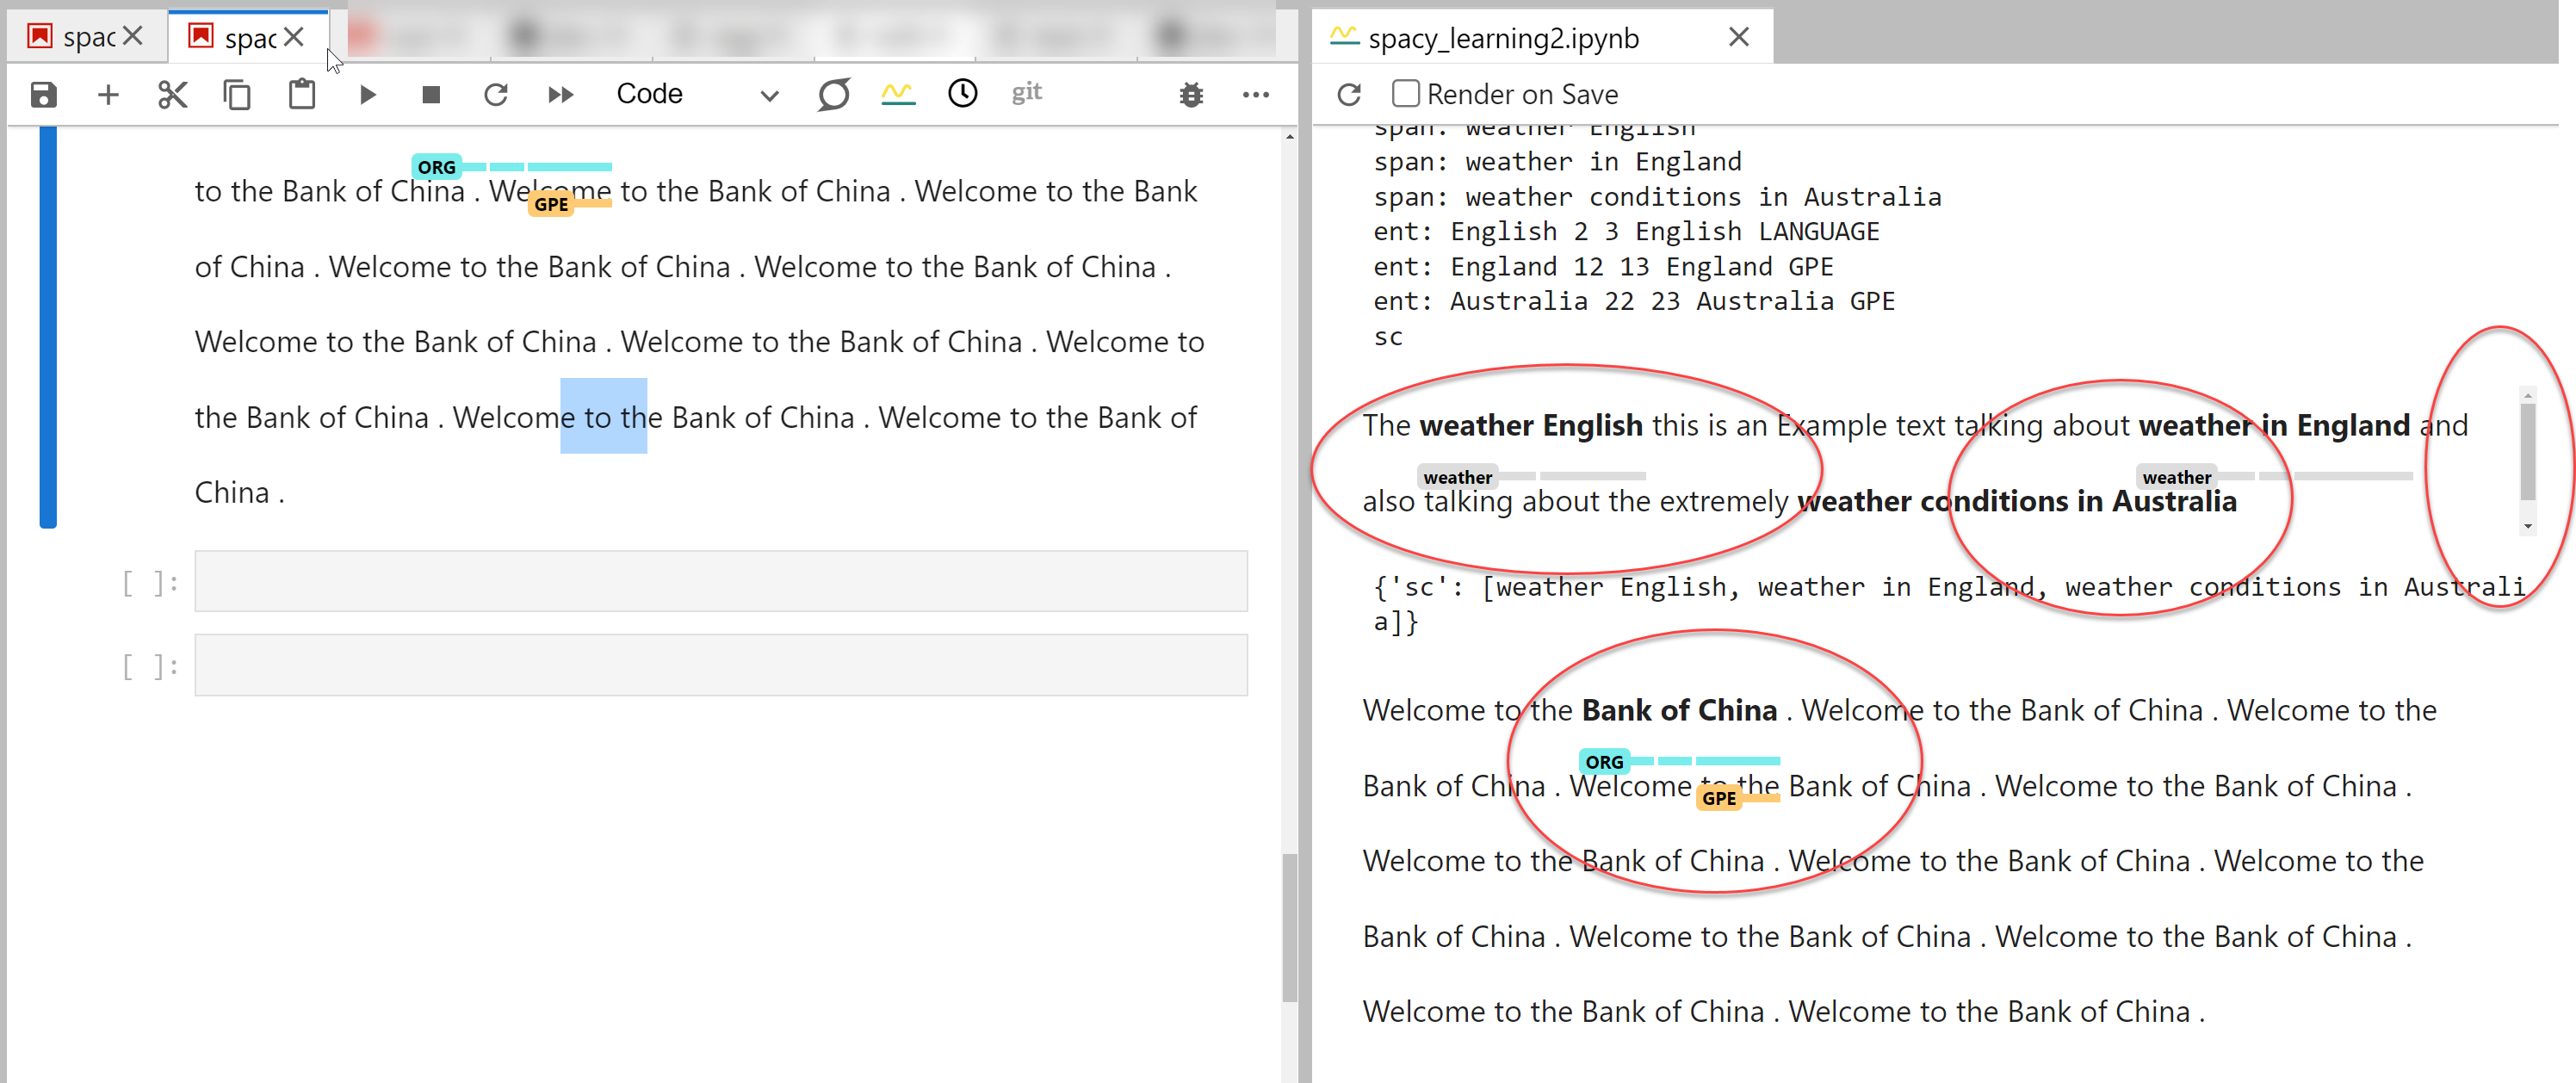
Hi @joseberlines , may I know what version your spaCy is? I can't seem to replicate it in both In any case, usually you'd find a scrollbar on the rightmost part of the output cell that "hides" these span labels. The fix in spaCy v3.4 removes the need to scroll though. |
Beta Was this translation helpful? Give feedback.
-
|
you are right about the scroll bar, I did not even realised, still I get something like: |
Beta Was this translation helpful? Give feedback.
-
|
I dont know if the problem is on my side or something could be improve in the spacy side |
Beta Was this translation helpful? Give feedback.
-
|
we also use voila with jupyter lab and the result when rendering with voila is: |
Beta Was this translation helpful? Give feedback.
-
|
Yes, I think v3.4.0 also solves the same problem. Can you try upgrading and see if this issue still persists? (Unless these screenshots are already in v3.4.0) |
Beta Was this translation helpful? Give feedback.
-
|
Thanks. I will update and report. |
Beta Was this translation helpful? Give feedback.
Hi @joseberlines , may I know what version your spaCy is? I can't seem to replicate it in both
jupyter notebookandjupyter labenvironments with spaCy v3.4. We encountered the same error before (c.f. #11040) and was able to have a fix (c.f. #10994) in v3.4. I highly encourage upgrading and trying again. You can check your spaCy version via:In any case, usually you'd find a scrollbar on the rightmost part of the output cell that "hides" these span labels. The fix in spaCy v3.4 removes the need to scroll though.