You signed in with another tab or window. Reload to refresh your session.You signed out in another tab or window. Reload to refresh your session.You switched accounts on another tab or window. Reload to refresh your session.Dismiss alert
We are using Fluentd to read logs from pods in our OpenShift clusters, and forwarding these logs to Kafka. We are using Prometheus to monitor our Fluentd instances and we've found that sometimes Fluentd misses a log rotation. The skipped logs are not processed later, they are lost.
Fluentd version: 1.14.0
Logs are attached. logs.log
As far as I can see, the issue is somewhere during the log rotation, as the logs disappers when the log rotation occurs (2022-07-29 11:17:01) and continue reading at 2022-07-29 11:33:01.
Input metrics:
The number of read logs for the problematic pod (file):
reacted with thumbs up emoji reacted with thumbs down emoji reacted with laugh emoji reacted with hooray emoji reacted with confused emoji reacted with heart emoji reacted with rocket emoji reacted with eyes emoji
Uh oh!
There was an error while loading. Please reload this page.
-
We are using Fluentd to read logs from pods in our OpenShift clusters, and forwarding these logs to Kafka. We are using Prometheus to monitor our Fluentd instances and we've found that sometimes Fluentd misses a log rotation. The skipped logs are not processed later, they are lost.
Fluentd version: 1.14.0
Fluentd in_tail config
Logs are attached.
logs.log
As far as I can see, the issue is somewhere during the log rotation, as the logs disappers when the log rotation occurs (2022-07-29 11:17:01) and continue reading at 2022-07-29 11:33:01.
Input metrics:
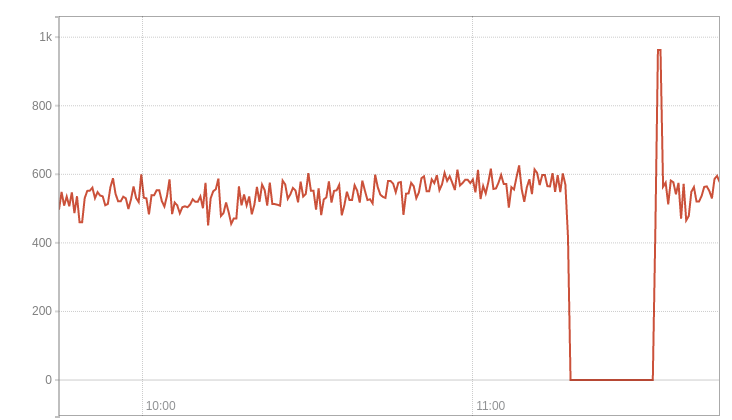
The number of read logs for the problematic pod (file):
Do you have any idea what can cause this issue?
Thanks in advance, Abel
Beta Was this translation helpful? Give feedback.
All reactions