Change Plot Question #873
Replies: 2 comments 5 replies
-
|
@AlexWennerDT Can you try this: The argument inside |
Beta Was this translation helpful? Give feedback.
-
|
Thank you that worked! |
Beta Was this translation helpful? Give feedback.
-
|
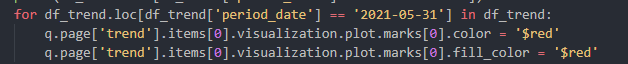
Hi! That line worked, but I am trying to conditionally change the plot points. I have this snippet of code: I would have expected it to only turn the points of data that are in the .loc. However it turns all of the points on my graph red, any thoughts? |

Beta Was this translation helpful? Give feedback.
-
|
A better / cleaner approach might be to use |
Beta Was this translation helpful? Give feedback.
-
|
Hm, I was looking into that but was unsure what that would look like with a dataframe(s) |
Beta Was this translation helpful? Give feedback.
-
|
Try this: import pandas as pd
from h2o_wave import site, data, ui
page = site['/demo']
df = pd.DataFrame({
'toy': ['X0', 'X1', 'X2', 'X3', 'X4'],
'height': [1, 2, 3, 4, 8],
'coloring': ['red', 'green', 'red', 'green', 'blue']
})
page.add('example', ui.form_card(
box='1 1 4 5',
items=[
ui.text_xl('Example'),
ui.visualization(
plot=ui.plot([ui.mark(type='interval', x='=toy', y='=height', color='=coloring',
color_domain=['blue', 'green', 'red'], color_range='blue green red')]),
data=data(fields='toy height coloring', columns=[df[col].to_list() for col in df.columns], pack=True)
)
]
))
page.save() |
Beta Was this translation helpful? Give feedback.
-
|
Thank you this is super helpful. I am trying to isolate a specific value in one of the columns. Would I just specify the color range and domain that specific value? Expecting it to color that data point different than the others? |
Beta Was this translation helpful? Give feedback.
Uh oh!
There was an error while loading. Please reload this page.
-
Trying to change a specific point on the plot conditionally, using an update that looks like:
q.page['trend'].items[0].visualization.plot.mark.color= '$red'
but having no luck. Is this the right way to change the parameters of a mark component?
The structure of the plot is ui.form_card -> items -> ui.visualization -> ui.plot -> ui.mark
Beta Was this translation helpful? Give feedback.
All reactions