Ability to configure maximum and minimum values for history graph #12622
Unanswered
reubenbijl
asked this question in
Dashboard
Replies: 1 comment 2 replies
-
|
|
Beta Was this translation helpful? Give feedback.
2 replies
-
|
Created a pull request with an initial version of this implemented. |
Beta Was this translation helpful? Give feedback.
-
|
Would appreciate some more feedback as wondering where you would stop adding configuration like this. |
Beta Was this translation helpful? Give feedback.
Sign up for free
to join this conversation on GitHub.
Already have an account?
Sign in to comment
Uh oh!
There was an error while loading. Please reload this page.
-
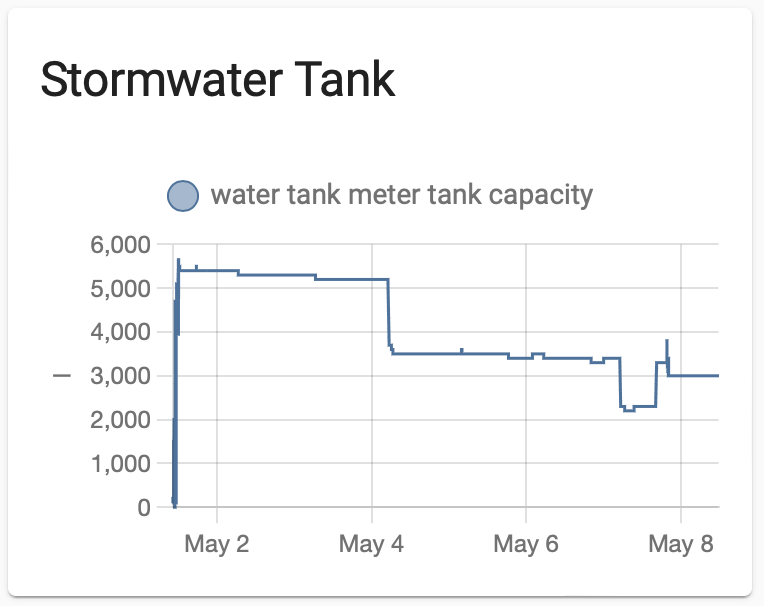
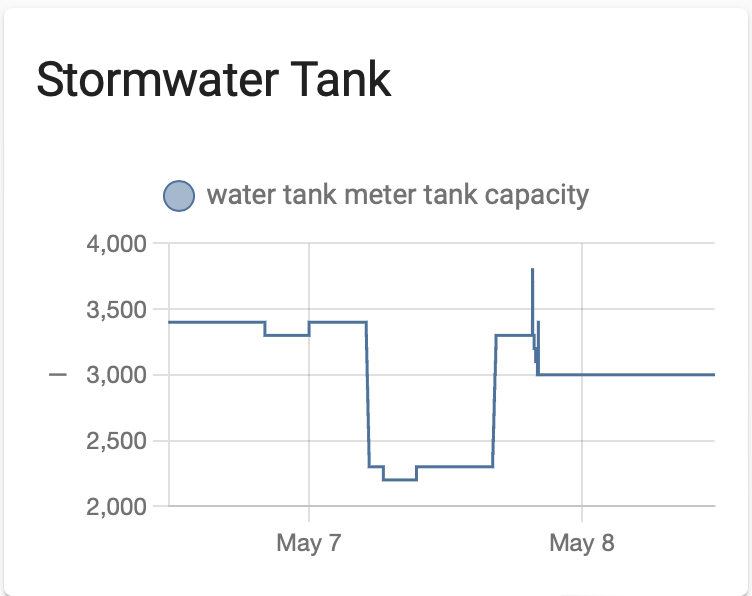
I have a use case with the history graph where it would be nice to configure the minimum and maximum. The use case is for a water tank, where I want a reference to 0, rather than the minimum y-axis being the minimum for the time period. Currently when you look at the graph from one day to another, the reference point changes.
Beta Was this translation helpful? Give feedback.
All reactions