You signed in with another tab or window. Reload to refresh your session.You signed out in another tab or window. Reload to refresh your session.You switched accounts on another tab or window. Reload to refresh your session.Dismiss alert
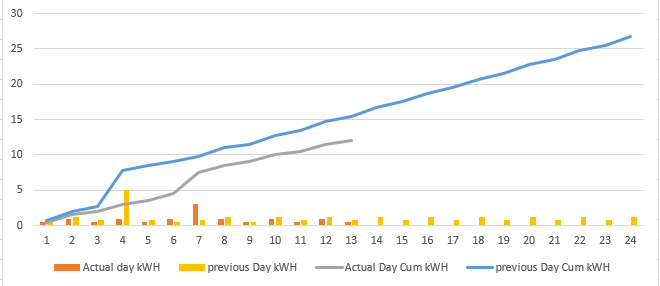
it would be nice to have a additional Line / Graph for "total usage" for normal view and comparsion.
Without this line i cant see if my total consumtion for example Comparing between 0:00 and 12:00 is good or bad. i need to add up every single interval in Diagram for comparing timeperiod as i see only Total value for previous day and partial value for actual day.
reacted with thumbs up emoji reacted with thumbs down emoji reacted with laugh emoji reacted with hooray emoji reacted with confused emoji reacted with heart emoji reacted with rocket emoji reacted with eyes emoji
Uh oh!
There was an error while loading. Please reload this page.
-
Hi,
it would be nice to have a additional Line / Graph for "total usage" for normal view and comparsion.
Without this line i cant see if my total consumtion for example Comparing between 0:00 and 12:00 is good or bad. i need to add up every single interval in Diagram for comparing timeperiod as i see only Total value for previous day and partial value for actual day.
example
Beta Was this translation helpful? Give feedback.
All reactions