
This pyPowerwall Caching Proxy handles authentication to the Powerwall Gateway and will proxy API calls to /api/meters/aggregates (power metrics), /api/system_status/soe (battery level), and many others (see API for full list). With the instructions below, you can containerize this proxy and run it as an endpoint for tools like telegraf to pull metrics without needing to authenticate.
Cache: Because pyPowerwall is designed to cache the auth and high frequency API calls and use HTTP persistent connections. This will help reduce the load on the Gateway and prevent crash/restart issues that can happen if too many session are created on the Gateway. Logic in pypowerwall will also activate cooldown modes if the Gateway responds with errors indicating overload.
Local or Cloud: The proxy uses the built in abstraction of pypowerwall to operate in two modes: local mode and cloud mode. Local mode will connect directly with your Powerwall's Tesla Energy Gateway (TEG) to pull realtime data. Cloud mode will connect to the Tesla cloud APIs to pull realtime data. Cloud mode has lower fidelity than local mode and does not include some data points available on the the local API.
Control Mode: An optional mode allows the proxy to send control commands to set backup reserve percentage and mode of the Powerwall. This requires that you set and use the PW_CONTROL_SECRET environmental variable. For safety reasons, this mode is disabled by default and should be used with caution.
-
Run the Docker Container to listen on port 8675. Update the
-evalues for your Powerwall (see Environmental Settings for options). Below are multiple examples depending on your desired access method. The local TEDAPI "full mode" access is recommended and works for all Powerwall systems (2, +, 3) but requires access to the Powerwall 192.168.91.1 (see here). The "cloud" mode example works for all systems and is required for Solar Only systems.# Local Access - TEDAPI "full mode" - Requires route to Powerwall 192.168.91.1 endpoint docker run \ -d \ -p 8675:8675 \ -e PW_PORT='8675' \ -e PW_HOST='192.168.91.1' \ -e PW_GW_PWD='Gateway_Password' \ -e PW_TIMEZONE='America/Chicago' \ -e TZ='America/Chicago' \ -e PW_CACHE_EXPIRE='5' \ -e PW_DEBUG='no' \ -e PW_HTTPS='no' \ -e PW_STYLE='clear' \ --name pypowerwall \ --restart unless-stopped \ jasonacox/pypowerwall # Local Access (Legacy) - Basic Metrics for PW2 and Pw+ systems (does not work for PW3) docker run \ -d \ -p 8675:8675 \ -e PW_PORT='8675' \ -e PW_PASSWORD='password' \ -e PW_EMAIL='email@example.com' \ -e PW_HOST='LAN_IP_of_Powerwall_Gateway' \ -e PW_GW_PWD='Optional_GW_Password_for_TEDAPI_hybrid_mode' \ -e PW_TIMEZONE='America/Los_Angeles' \ -e TZ='America/Los_Angeles' \ -e PW_CACHE_EXPIRE='5' \ -e PW_DEBUG='no' \ -e PW_HTTPS='no' \ -e PW_STYLE='clear' \ --name pypowerwall \ --restart unless-stopped \ jasonacox/pypowerwall # Note for TEDAPI hybrid mode PW_HOST must be set to 192.168.91.1 # Cloud Mode Setup - Basic Metrics for all Powerwall and Solar Only Systems docker run \ -d \ -p 8675:8675 \ -e PW_PORT='8675' \ -e PW_EMAIL='email@example.com' \ -e PW_HOST='' \ -e PW_TIMEZONE='America/Los_Angeles' \ -e TZ='America/Los_Angeles' \ -e PW_CACHE_EXPIRE='5' \ -e PW_DEBUG='no' \ -e PW_HTTPS='no' \ -e PW_STYLE='clear' \ --name pypowerwall \ --restart unless-stopped \ jasonacox/pypowerwall # Required login process for Cloud Mode docker exec -it pypowerwall python3 -m pypowerwall setup -email=email@example.com docker restart pypowerwall
-
Test the Proxy
# Get Powerwall Data
curl -i http://localhost:8675/soe
curl -i http://localhost:8675/aggregates
curl -i http://localhost:8675/vitals
curl -i http://localhost:8675/strings

# Get Proxy Stats
curl -i http://localhost:8675/stats

# Clear Proxy Stats
curl -i http://localhost:8675/stats/clear
This folder contains the server.py script that runs a simple python based webserver that makes the pyPowerwall API calls.
The Dockerfile here will allow you to containerize the proxy server for clean installation and running.
-
Build the Docker Container
# Build for local architecture
docker build -t pypowerwall:latest .

# Build for all architectures - requires Docker experimental
docker buildx build --platform linux/amd64,linux/arm64,linux/arm/v7 -t pypowerwall:latest .
-
Setup the Docker Container to listen on port 8675.
docker run \ -d \ -p 8675:8675 \ --name pypowerwall \ --restart unless-stopped \ pypowerwall -
Test the Proxy
curl -i http://localhost:8675/soe
curl -i http://localhost:8675/aggregates
Browse to http://localhost:8675/ to see Powerwall web interface.
The Proxy will pass authenticated calls through to the Powerwall Web Interface allowing the display of the Power Flow Animation:
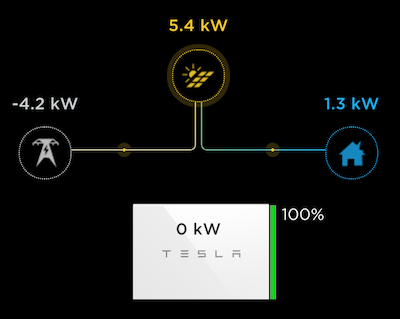
This is available by directly accessing the proxy endpoint, https://localhost:8675 (replace localhost with the address of host running pyPowerWall Proxy). You can embed this animation within an iFrame. See web/example.html.
By default resources sent for the power flow animation passthrough are not cached by the browser. This includes fairly large CSS, JavaScript and Image PNG files which are downloaded every time the browser reloads the animation. Performance can be improved by directing the web browser to cache these resources locally - only reloading if the data in the cache is old, a period known as max-age.
You can control this with an optional environment variable PW_BROWSER_CACHE which takes a value in seconds. For example,
- PW_BROWSER_CACHE=86400 - set
max-ageto 24 hours.
If PW_BROWSER_CACHE is not set, or set to zero, then no caching takes place. If you need to force a reload of the browser cache before max-age then most browsers will do this if you hold down the shift key while reloading the page.
The Proxy now supports https protocol using the optional environmental variable PW_HTTPS. This is useful for placing data in secured iFrame, including the power flow animation available via the Powerwall portal (https://localhost:8675/).
There are three settings for PW_HTTPS:
- PW_HTTPS='no' - This is default - run in HTTP mode only.
- PW_HTTPS='http' - Run in HTTP mode but simulate HTTPS when behind https proxy.
- PW_HTTPS='yes' - Run in HTTPS mode using self-signed certificate.
The proxy includes advanced network error handling designed for environments with weak WiFi or unstable network connections. These features help ensure reliable operation with monitoring tools like Telegraf:
- Graceful Degradation (PW_GRACEFUL_DEGRADATION=yes): Returns cached data when fresh data is unavailable, improving reliability for monitoring systems
- Health Monitoring (PW_HEALTH_CHECK=yes): Tracks connection health and automatically enters degraded mode after consecutive failures
- Data Freshness (PW_CACHE_TTL=30): Controls maximum age for cached data - returns null instead of stale data after TTL expires
- Fail-Fast Mode (PW_FAIL_FAST=no): When enabled, returns immediately in degraded mode instead of waiting for timeouts
- Error Suppression (PW_SUPPRESS_NETWORK_ERRORS=no): Suppresses individual network error logs, showing summary reports every 5 minutes instead
- Rate Limiting (PW_NETWORK_ERROR_RATE_LIMIT=5): Limits network error logging to N errors per minute per function
/health- Returns connection health status, cache information, and feature configuration/health/reset- Resets health counters and clears cached data/stats- Includes connection health metrics when health monitoring is enabled
docker run \
    -d \
    -p 8675:8675 \
    -e PW_HOST='192.168.91.1' \
    -e PW_GW_PWD='Gateway_Password' \
    -e PW_TIMEOUT='3' \
    -e PW_SUPPRESS_NETWORK_ERRORS='yes' \
    -e PW_FAIL_FAST='yes' \
    -e PW_CACHE_TTL='60' \
    --name pypowerwall \
    --restart unless-stopped \
jasonacox/pypowerwallThe proxy prioritizes data freshness over availability. Key endpoints (/aggregates, /soe, /vitals, /strings) return:
- Fresh data when available
- Cached data if recent (within PW_CACHE_TTL)
nullwhen no fresh or recent cached data exists (never returns fake/zero values)
This ensures monitoring systems can distinguish between actual zero values and missing/stale data.
If you see python errors, make sure you entered your credentials correctly in docker run.
# See the logs
docker logs pypowerwall

# Stop the server
docker stop pypowerwall

# Start the server
docker start pypowerwall
Content does not render in iFrame or prompts you for a login:
- Browser may be set to never accept third party cookies. The web app requires cookies and in an iFrame it will look like a third party, see here).
- iFrame doesn't render. Make sure the browser is not running in incognito mode. Try other browsers.
Documentation for using the API is located in API.md.
The pyPowerwall Proxy will react to the following environmental variables with (defaults):
Powerwall Settings
- PW_GW_PWD - Powerwall gateway (or PW3) password [required for TEDAPI extended metrics mode]
- PW_EMAIL - Powerwall customer email ("email@example.com") [required for cloudmode]
- PW_HOST - Powerwall hostname or IP address ("hostname") [required for local mode, e.g. 192.168.91.1]
- PW_TIMEZONE - Local timezone ("America/Los_Angeles") [optional]
- PW_PASSWORD - Powerwall customer password ("password") [optional PW2 local access mode]
Proxy Settings
- PW_BIND_ADDRESS - IP address ("") - Required
- PW_PORT - TCP port ("8675")
- PW_DEBUG - Turn on debug logging ("no")
- PW_CACHE_EXPIRE - Time to cache responses from Powerwall in sec ("5")
- PW_BROWSER_CACHE - Sets Cache-Control for browser in sec ("0" = no-cache)
- PW_TIMEOUT - Timeout waiting for Powerwall to respond in sec ("10")
- PW_POOL_MAXSIZE - Concurrent connections to Powerwall ("15")
- PW_HTTPS - Set https mode - see HTTPS section above ("no")
Network Robustness Settings
- PW_SUPPRESS_NETWORK_ERRORS - Suppress individual network error logs ("no") - When enabled, shows summary reports every 5 minutes instead
- PW_NETWORK_ERROR_RATE_LIMIT - Limit network errors logged per minute per function ("5")
- PW_FAIL_FAST - Return immediately when connection is degraded ("no") - Reduces timeout delays in poor network conditions
- PW_GRACEFUL_DEGRADATION - Return cached data when fresh data unavailable ("yes") - Improves reliability for monitoring tools
- PW_HEALTH_CHECK - Enable connection health monitoring and degraded mode detection ("yes")
- PW_CACHE_TTL - Maximum age in seconds for cached data before returning null ("30") - Ensures data freshness over availability
UI and Advanced Settings
- PW_STYLE - Background color style for iframe animation ("clear") - options:
- clear (uses
transparent) - black or dakboard (uses
#000)
- white (uses
#ffffff)
- grafana (uses
#161719)
- grafana-dark (uses
#111217)
- clear (uses
- PW_AUTH_PATH - Location (path) for authentication and cache files ("")
- PW_AUTH_MODE - Use
cookie(default) ortokenfor authentication - PW_CACHE_FILE - Proxy cache file path, with override PW_AUTH_PATH if provided (".powerwall")
- PW_SITEID - For
cloud mode, if you have multiple sites configured, use this site ID ("") - PW_CONTROL_SECRET - If provided, will activate the Powerwall control commands to adjust Powerwall backup reserve level and mode (disabled by default)
- PROXY_BASE_URL - If you are using a reverse proxy to put pypowerwall in a subdirectory, set it here to adjust the URLs for the flow animation (
/by default)


If the PW_CONTROL_SECRET environmental variable is set, the proxy will attempt to connect to the cloud in addition to local mode setup (if you are using local mode). The PW_EMAIL must match your Tesla account and you need to Setup Cloud (see details below in script) before using this mode.
WARNING: Activating control mode means that the proxy can make changes to your system. This will be available to anyone who can access the proxy. For safety reasons, this mode is disabled by default and should be used with caution.
# Run Proxy - Example using local TEDAPI full mode
docker run \
    -d \
    -p 8675:8675 \
    -e PW_PORT='8675' \
    -e PW_GW_PWD='Gateway_Password' \
    -e PW_HOST='192.168.91.1' \
    -e PW_TIMEZONE='America/Los_Angeles' \
    -e TZ='America/Los_Angeles' \
    -e PW_EMAIL='email@example.com' \
    -e PW_CONTROL_SECRET='YourSecretToken' \
    --name pypowerwall \
    --restart unless-stopped \
    jasonacox/pypowerwall

# Setup Cloud
docker exec -it pypowerwall python3 -m pypowerwall setup -email=email@example.com
docker restart pypowerwall
APIs
- Use
GETmethod to read andPOSTto set. - Mode:
/control/modevalue=$MODE token=$PW_CONTROL_SECRET - Reserve:
/control/reservevalue=$RESERVE token=$PW_CONTROL_SECRET
Examples
export MODE=self_consumption
export RESERVE=20
export PW_CONTROL_SECRET=YourSecretToken

# Set Mode
curl -X POST -d "value=$MODE&token=$PW_CONTROL_SECRET" http://localhost:8675/control/mode

# Set Reserve
curl -X POST -d "value=$RESERVE&token=$PW_CONTROL_SECRET" http://localhost:8675/control/reserve

# Enable Grid Charging (true/false)
curl -X POST -d "value=true&token=$PW_CONTROL_SECRET" http://localhost:8675/control/grid_charging

# Set Grid Export (battery_ok, pv_only, or never)
curl -X POST -d "value=battery_ok&token=$PW_CONTROL_SECRET" http://localhost:8675/control/grid_export

# Read Settings
curl http://localhost:8675/control/mode
curl http://localhost:8675/control/reserve
curl http://localhost:8675/control/grid_charging
curl http://localhost:8675/control/grid_exportThe proxy includes a performance testing script (perf_test.py) that helps analyze the response times and performance characteristics of your Powerwall proxy and underlying Powerwall system. This tool is invaluable for identifying slow endpoints, validating caching improvements, and ensuring optimal performance across all API routes.
The performance test script:
- Tests response times for all commonly used API endpoints based on real production usage patterns
- Provides comprehensive metrics including average, minimum, and maximum response times
- Identifies optimization opportunities by calculating impact scores (response time × usage frequency)
- Validates caching effectiveness by showing dramatic improvements in cached vs uncached performance
- Monitors system health across the full range of API calls your applications typically make
# Basic usage - test against default proxy (localhost:8675)
cd proxy
python perf_test.py

# Test against different host/port
python perf_test.py --host 192.168.1.100 --port 8675

# Custom number of test requests per route (default: 5)
python perf_test.py --requests 10

# Test with timeout adjustment (default: 10 seconds)
python perf_test.py --timeout 30

# Full example with all options
python perf_test.py --host myproxy.local --port 9999 --requests 3 --timeout 15The script provides detailed performance analysis including:
- Per-route metrics: Average, min, max response times with color-coded performance indicators
- Impact analysis: Routes sorted by performance impact (response time × usage frequency)
- Optimization candidates: Identifies the most critical routes for performance improvements
- Response size tracking: Monitors payload sizes to identify potential bandwidth issues
- Overall statistics: System-wide performance summary
Example output shows routes color-coded by performance:
- 🟢 Green: Good performance (< 100ms average)
- 🟡 Yellow: Moderate performance (100ms - 500ms average)
- 🔴 Red: Slow performance (> 500ms average)
Sample Output:
Route                               Avg (ms)   Min (ms)   Max (ms)   Usage    Impact     Size (B)
----------------------------------------------------------------------------------------------------
🟡 /temps/pw                         749.3     2.3       3731.4    3880    2907      2
🟡 /pod                              669.3     1.6       3339.4    3880    2597      2016
🟢 /alerts/pw                        399.8     2.7       1983.1    3881    1551      340
🟢 /api/meters/aggregates            145.2     2.7       709.5     7992    1160      2838
🟢 /strings                          205.0     2.8       1010.1    3945    809       1801
🟢 /freq                             196.7     1.7       974.5     3946    776       2284
🟢 /csv/v2                           229.7     1.9       1139.2    1923    442       44
🟢 /csv                              100.7     2.6       489.0     2614    263       39
🟢 /vitals                           61.0      2.8       289.4     3946    241       7974
🟢 /api/system_status/grid_status    18.7      1.3       86.8      7992    149       68
🟢 /api/powerwalls                   2.8       2.3       3.6       7992    22        7398
🟢 /api/sitemaster                   2.5       1.8       3.2       7990    20        116
🟢 /soe                              4.4       2.6       8.7       3880    17        34
🟢 /fans/pw                          4.0       2.8       6.8       3880    15        2
🟢 /api/system_status/soe            1.7       1.2       2.4       7992    14        34
🟢 /version                          28.7      1.5       135.6     461     13        47
🟢 /api/troubleshooting/problems     2.7       2.0       4.0       4049    11        16
🟢 /aggregates                       2.5       2.0       3.3       3880    10        2838
🟢 /api/auth/toggle/supported        3.0       2.4       4.1       2071    6         31
🟢 /api/site_info                    2.3       1.9       3.1       651     1         426
🟢 /stats                            2.1       1.5       2.9       324     1         1845
🟢 /csv/v2?headers                   293.2     2.3       1451.9    1       0         100
🟢 /api/status                       3.8       2.6       7.0       2       0         312
🟢 /api/site_info/site_name          2.9       2.2       4.0       1       0         59
🟢 /api/customer/registration        2.5       1.6       3.8       1       0         41
🟢 /api/system_status/grid_faults    1.9       1.8       2.3       1       0         2
🟢 /api/networks                     1.5       1.1       2.2       1       0         10

--------------------------------------------------------------------------------
OVERALL STATISTICS:
  Fastest route: 1.5ms
  Slowest route: 749.3ms
  Average response time: 116.2ms
  Total usage count: 87,176

🎯 TOP CANDIDATES (slow + high usage):
   1. /temps/pw                           (749.3ms × 3880 = 2907s impact)
   2. /pod                                (669.3ms × 3880 = 2597s impact)
   3. /alerts/pw                          (399.8ms × 3881 = 1551s impact)
   4. /api/meters/aggregates              (145.2ms × 7992 = 1160s impact)
   5. /strings                            (205.0ms × 3945 = 809s impact)
   6. /freq                               (196.7ms × 3946 = 776s impact)
   7. /csv/v2                             (229.7ms × 1923 = 442s impact)
   8. /csv                                (100.7ms × 2614 = 263s impact)
   9. /csv/v2?headers                     (293.2ms × 1 = 0s impact)
- After proxy setup: Establish baseline performance metrics
- Performance optimization: Before/after testing when implementing caching or other improvements
- System monitoring: Regular checks to ensure consistent performance
- Troubleshooting: Identify which specific routes are experiencing performance issues
- Capacity planning: Understand system behavior under different loads
The script tests 27 different API routes based on real production usage patterns, ensuring comprehensive coverage of your proxy's performance characteristics.
Release notes are in the RELEASE.md file.