Filtering metrics via Telegraf before output to InfluxDB #112
Replies: 6 comments 20 replies
-
|
Great work @mcbirse! While I don't have an immediate application for it, I'm guessing I'll be down the rabbit hole of tweaking my own data before too long.
This might be real - it looks like my Fronius inverter has an 8W continuous draw at night, while my ABB has a flatline 0W. I've got a vague memory that the Fronius webserver is available at night (on my to do list item to check/disable this). I'll take a look this evening and report back. |
Beta Was this translation helpful? Give feedback.
-
|
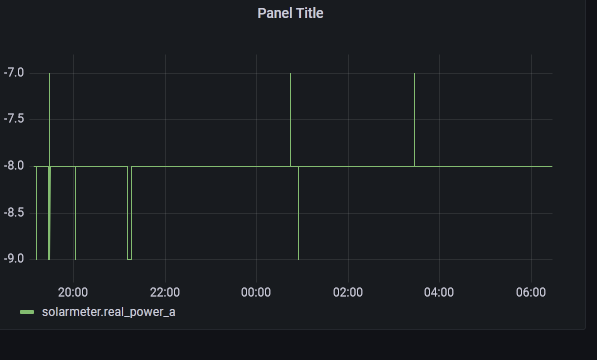
Interesting! Let us know what you find... I'm seeing a -9W solar generation value during nighttime. I figured it's probably from the inverters in standby mode or similar (maybe I should try turning them off fully to confirm this...). I'm inclined to zero this in my data to InfluxDB now that I can though. |
Beta Was this translation helpful? Give feedback.
-
|
Very nice, thanks for the flexibility @mcbirse
… On Oct 24, 2022, at 7:34 PM, BuongiornoTexas ***@***.***> wrote:
Great work @mcbirse <https://github.com/mcbirse>! While I don't have an immediate application for it, I'm guessing I'll be down the rabbit hole of tweaking my own data before too long.
I see very small negative solar generation values, which I think cumulative amounts of may skew my solar generation totals - so the plugin can be used to set negative values to zero, for instance.
This might be real - it looks like my Fronius inverter has an 8W continuous draw at night, while my ABB has a flatline 0W. I've got a vague memory that the Fronius webserver is available at night (on my to do list item to check/disable this). I'll take a look this evening and report back.
—
Reply to this email directly, view it on GitHub <#112 (comment)>, or unsubscribe <https://github.com/notifications/unsubscribe-auth/AJWC2EBDOLEN74YEEMFJRALWE5BKXANCNFSM6AAAAAARNQO4TM>.
You are receiving this because you were mentioned.
|
Beta Was this translation helpful? Give feedback.
-
I always thought the pitch-black sky was trying to take some of the power back! :) Nice work on this. Seems like it could be very useful. |
Beta Was this translation helpful? Give feedback.
-
|
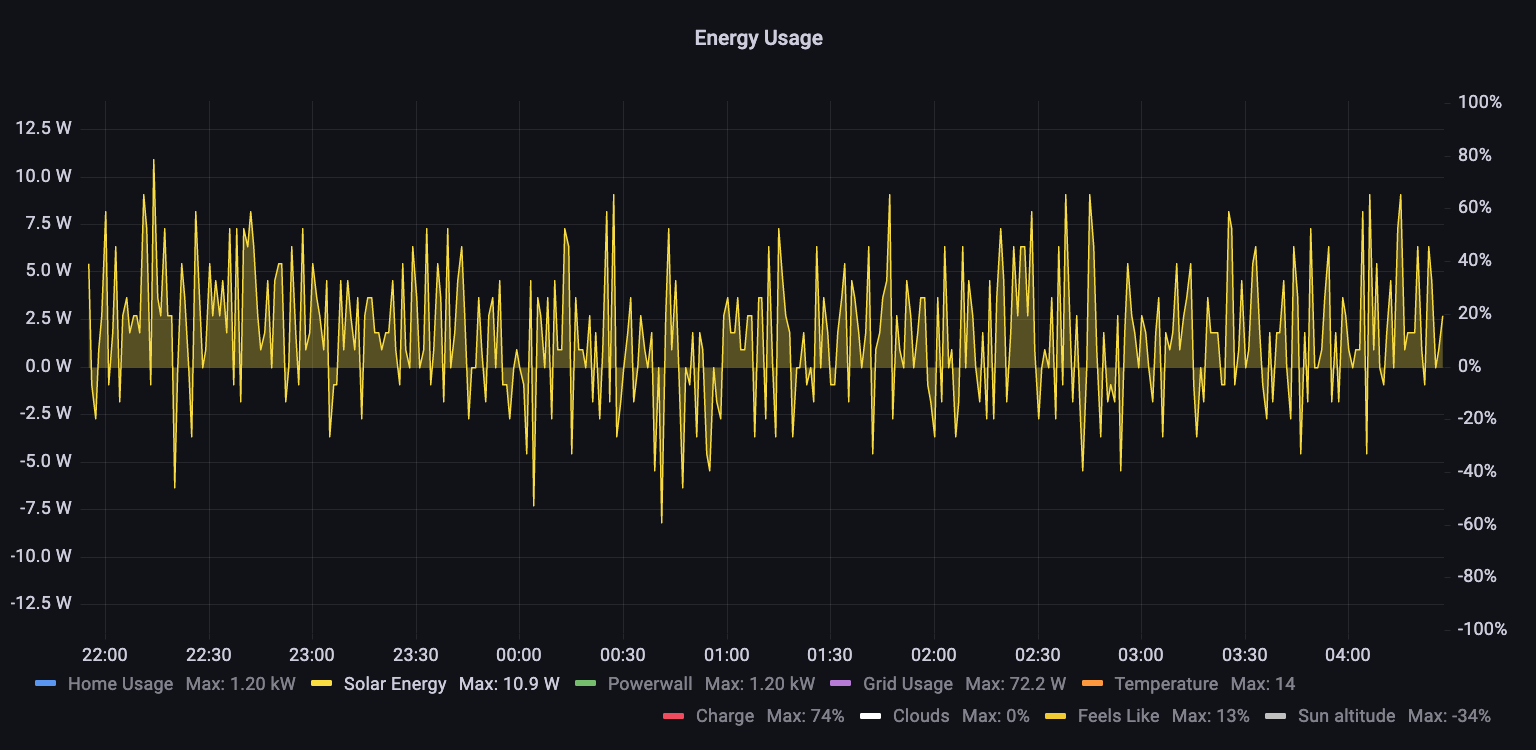
I love this! Great work @mcbirse ! As to the negative solar data... I never thought to zoom in on the solar power data at night. For my system, I'm getting positive and negative fluctuations. The sum() is actually net positive.
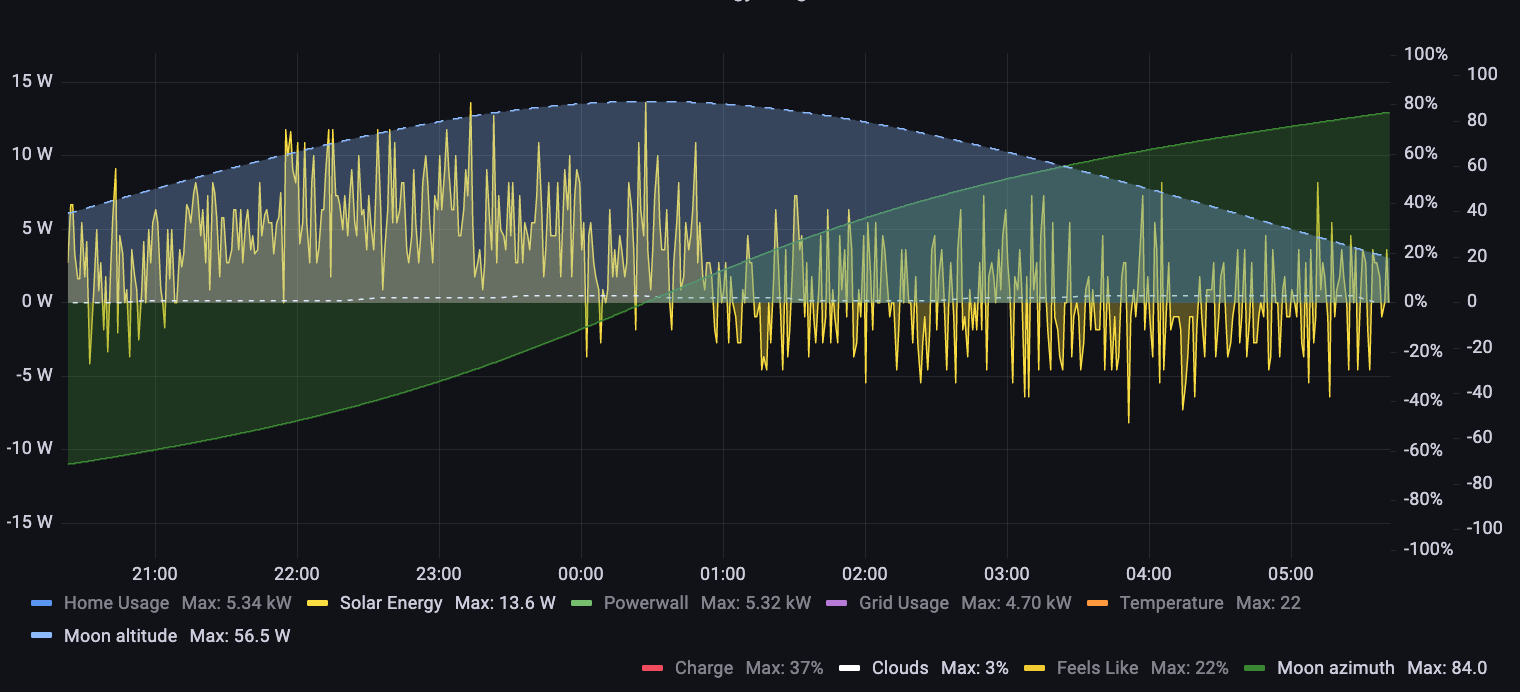
My first reaction is that this is just noise in the system. I mean, I'm in SoCal and we have a lot of light pollution at night, but surely that wouldn't show up. But then I had a thought... what about the moon? Would it show up? We had a full moon on Oct 9th. I pulled that data:
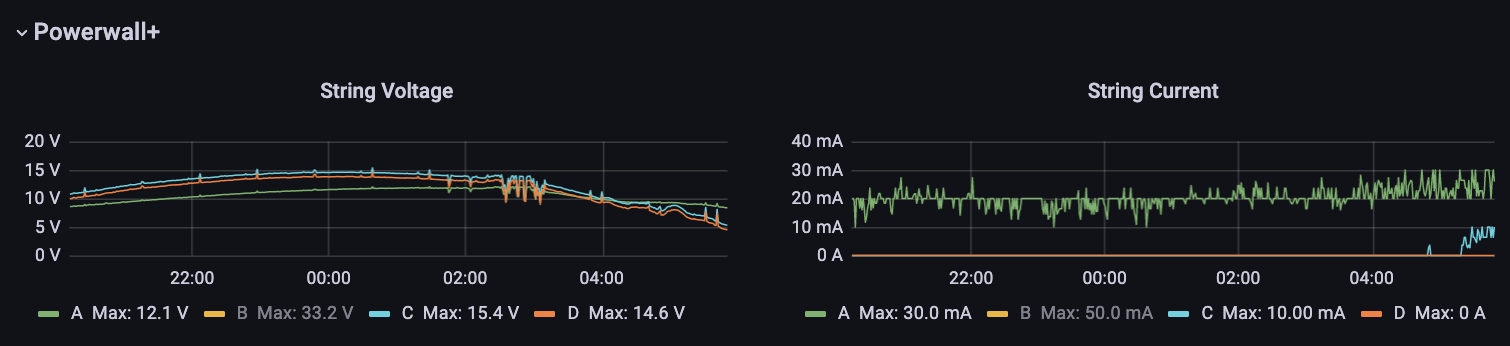
What?! Could that be the moon? I added the Moon's altitude & azimuth overlay... and clouds (was a clear night). But a quick look at the string data and inverter and it seems this is unlikely. The Neurio RGM is being used for my solar measurements so I suspect it is picking up noise, but the bubble around 9pm-1am is just uncanny.
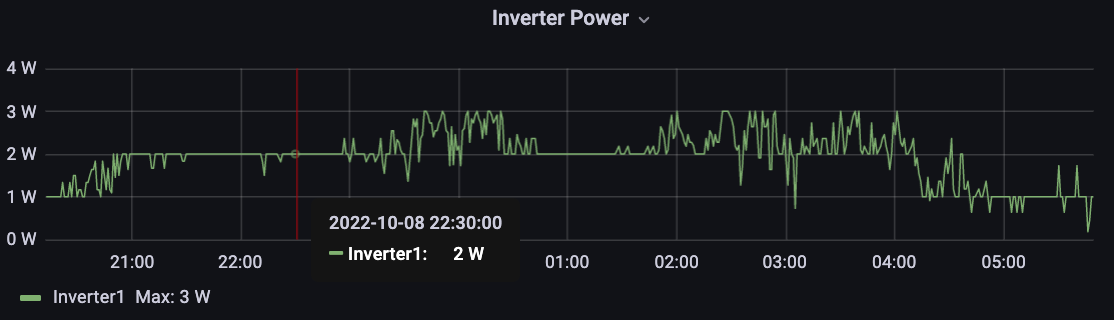
As a note, the PW+ inverter numbers never go below zero (0W) and stay at about 1-3W during the night. |
Beta Was this translation helpful? Give feedback.
-
I'm less certain about it being noise for everyone - One one phase, we draw ~120W continuous overnight, with the solar being ~-8w (and this is almost flatline from the 5s data sets - see below). If that's induced noise, it's pretty major - more than 5% of the load. For our system at least, it looks more like either a zero offset or a very low heartbeat draw from the inverter. By comparison, the other phase with an inverter has an overnight vampire home load of 20W continuous and 0.0000W on the solar - and this is the one I'd expect to be noisy, as the CT line runs parallel to all three phase main lines inbound and outbound over a 3 or 4 m run (gateway is a bit away from our meter box, and all three phase supply lines are run from the utility meter to the gateway and back again). Maybe the explanation will vary with both installation details and grid behaviour? It'll be interesting to see where we can get to collectively on this.
@jasonacox - I saw some posts on potential for moonlight generation earlier today - I didn't dip into them in detail, but I think you'd find a fair bit on the topic with a quick search (a couple had youtube videos embedded). |
Beta Was this translation helpful? Give feedback.
-
|
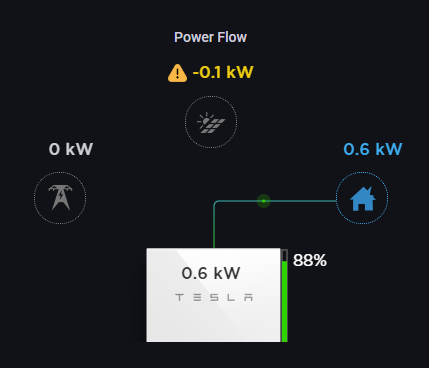
I sometimes see the negative solar generation in my Power Flow meter - anyone else get this also?
Interestingly, even though this shows as -0.1kW, when I check the data logged in the cloud with the Tesla History import tool - Tesla appears to be zeroing negative solar power data as well, as I have no negative solar values in over a year of data imported from the cloud. |
Beta Was this translation helpful? Give feedback.
-
|
Just checked my inverters readings after sunset. The ABB read a negative value up to 8pm and then stopped altogether. I'm guessing just enough light to hold on to the grid and then dropping out? My memory for the Fronius was wrong - I had already switched the webserver and data logger off overnight - so no vampire draw there. The Fronius read a bouncing negative value until a up to around 7:15pm and then holds at various levels between 0 and -10W for anywhere between 10 minutes and an hour, with short ramps between the holds. If it's noise, it's insanely low frequency, and if it's zero offset, it has a low frequency drift, neither of which seem right. So I'm none the wiser on what's actually happening. But, at this point, I agree with @mcbirse - it looks like it is zero actual power on both phases.
@mcbirse - Can confirm that Tesla cloud does not report and/or corrects data that doesn't make sense. Still working up the detail on this, but I know we ran for about a week with a missing solar CT. This resulted in the local webview reporting a negative production from the house. The cloud/app "corrected" this to solar production - which was more or less the right call. Hopefully, I'll have more on this soon. |
Beta Was this translation helpful? Give feedback.
-
|
And of course, my inverters like to mess with me. Happened to be outside tonight at 9:50, full dark bucketing down, well past sunset, absolutely no prospect of panel generation. Fronius interface is naturally up and working (status light up, LCD interface operating) - unlike 2 nights ago. Absolutely no idea what is happening at this point, but can now confirm at least part of the time the vampire drain at night can be operating inverter electronics. |
Beta Was this translation helpful? Give feedback.
-
|
@mcbirse - I have never seen the power flow show negative like the screenshot you posted. |
Beta Was this translation helpful? Give feedback.
-
|
I just saw today a negative value show up today for the Powerflow Animation. |
Beta Was this translation helpful? Give feedback.
-
Just thought I would post an update this.... My Powerwall firmware updated from "22.18.3 21c0ad81" to "22.26.2 8cd8cac4" yesterday, and the filter script I added as per my example worked perfectly. So, during the firmware update, the gateway responds with zero values for the below metrics for a period of about 3.5 minutes. The telegraf log above shows those metrics were removed, as per the script, which is what I wanted so the zero values would not be logged to InfluxDB and won't appear in the dashboard. Timing of firmware update events:
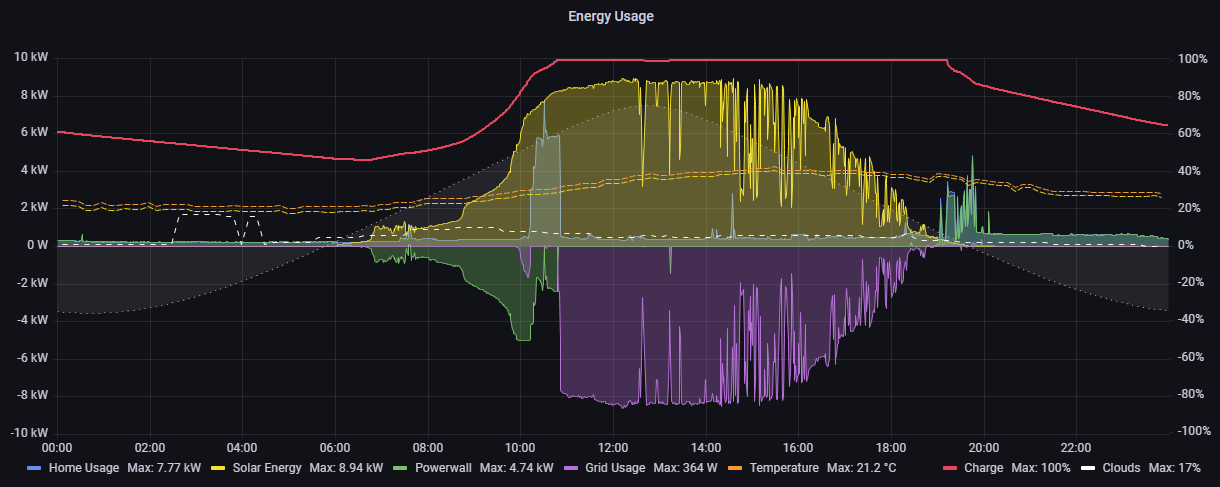
Confirmed the zero values were filtered out, otherwise the charge percentage would show a drop to zero at about 12:40pm below.
I think there is a small issue with the pypowerwall proxy however after a firmware update... Everything was logging again correctly after the update, however the Power Flow meter was no longer working. It would just appear to be "flashing" on/off in the browser. I had to restart the pypowerwall container to fix this. If I have a chance I'll investigate further - quite hard to test though since firmware updates don't happen very often! |
Beta Was this translation helpful? Give feedback.
-
|
Definitely a nice to have! |
Beta Was this translation helpful? Give feedback.
-
|
I love trying new stuff. Count me in |
Beta Was this translation helpful? Give feedback.
-
|
That's awesome! |
Beta Was this translation helpful? Give feedback.
-
|
Awesome! I pushed the Build t22 to "latest" so you will get it if you docker stop pypowerwall
docker rm pypowerwall
docker images | grep pypowerwall | awk '{print $3}' | xargs docker rmi -f
./compose-dash.sh up -dI've also pushed the change to dashboard.json to add the PW Firmware version to the Power-Flow animation. Thanks everyone! Let me know how it goes. 😁 🙏 |
Beta Was this translation helpful? Give feedback.
-
|
These are working great, and nice add-ons to the collective, @jasonacox! :) Thanks for the deep-dive on the reasoning for this as well, @mcbirse and @jasonacox... thought my curve looked out of whack when I got an update as well the other day... ;) |
Beta Was this translation helpful? Give feedback.
-
|
So far so good. Thanks! |
Beta Was this translation helpful? Give feedback.
Uh oh!
There was an error while loading. Please reload this page.
Uh oh!
There was an error while loading. Please reload this page.
-
There was some discussion recently regarding "invalid" data being output to InfluxDB.
Specifically, it appears that during Powerwall firmware updates, the local gateway will return a value of "zero" for certain metrics, i.e. battery charge level and power usage values.
Since the local gateway is still returning values, rather than "no data", these "zero" values will be output to InfluxDB and can be seen in Powerwall-Dashboard - example can be seen in #109 with @cwagz's graph showing the battery level drop to zero during a firmware upgrade.
Also, @ibmaster noted in #101 and #103 he had invalid zero value data, that he did not want in the database, and was looking to remove them.
I had been thinking a change to pypowerwall to filter the output could be a solution. As @jasonacox has mentioned though, and I completely agree, the pyPowerwall library is an API for the Powerwall and the expectation is that it delivers accurately what Tesla is saying.
It does seem to be more of a personal choice if someone would prefer to filter out the zero value data, or allow it. If it is not filtered, it certainly is quite easy to identify a firmware update or issue by viewing the dashboard graphs.
However, my personal preference is actually that the zero value data being output is not really valid - the battery charge level did not suddenly drop to zero - so I don't want it to be logged like that and would prefer "no data" to be logged during this event.
As such, I found a way to filter any metrics before it is output to InfluxDB, and thought I would share this.
This is done by using the Telegraf Starlark Processor Plugin, which allows you to intercept metrics and manipulate them in some way based on whatever conditions you like (i.e. remove a metric, change a value, add a new metric, etc.) - and this is done before the metrics are output to InfluxDB.
I think this plugin could be useful in a number of circumstances - e.g. for some reason during nighttime, I see very small negative solar generation values, which I think cumulative amounts of may skew my solar generation totals - so the plugin can be used to set negative values to zero, for instance.
Here's an example of how you could implement this. The language used by the plugin is very similar to python.
Thanks to @BuongiornoTexas for localizing some of the telegraf configs, which has made this easy to implement for your own setup now. 😊
telegraf.localfile[[processors.starlark]]and then add your source scriptThe example below does the following:
After saving
telegraf.localwith your changes, restart the container to start using the filter:# Restart telegraf docker restart telegrafIf you have log output in your filter, you can view this as follows:
# View telegraf logs
docker logs -f telegraf
Some important things to note if you wish to implement your own filtering:
Because not all metrics and passed in the one call, I was doing some testing with shared state usage. This means you can store the previous value of a metric in a global shared state for later retrieval by a subsequent call to the plugin.
Below is an example which may be useful if you need to implement your own shared state type filter (important: the "state" dictionary variable name needs to be "state" - don't rename it!)
Hopefully the above info is useful for anyone that needs to filter metrics before they are output to InfluxDB.
I think there is potentially a number uses for this, and am using this myself now to filter out zero value data during firmware upgrades of my Powerwall (...hopefully 🤞 - waiting for the next firmware upgrade to actually happen so I can confirm it works).
Beta Was this translation helpful? Give feedback.
All reactions