Replies: 2 comments
-
|
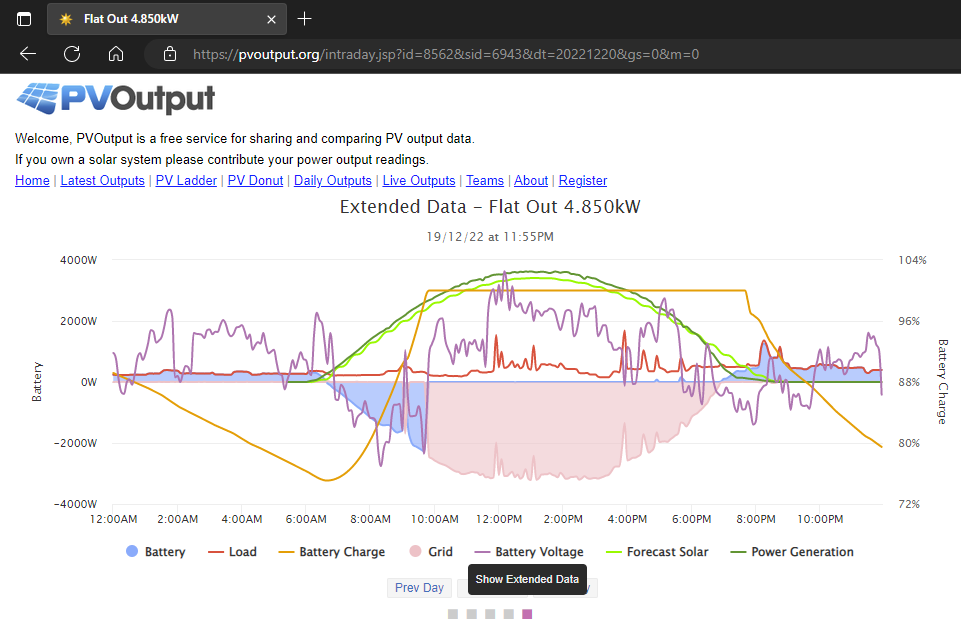
OK, at a quick glance, that last link looks like what I've also been thinking about. There are lots of options for insolation forecasts. I'm lucky enough to be able to use system specific forecasts for my system from https://solcast.com/ as I was an early adopter during their beta, so snagged a free hobbyist API key. You can see the forecast at https://pvoutput.org/intraday.jsp?id=8562&sid=6943&dt=20221220&gs=0&m=0 and if you click on the right most square out of five as shown in the image below (where it says show extended data) you can see the insolation forecast. Scroll back a few days and you can see the forecast for a less sunny day. This data is half-hourly, available seven days in advance, and updated throughout the day, though I only get 20 calls per day under my free licence (so I call it between an hour before sunrise, to sunset).
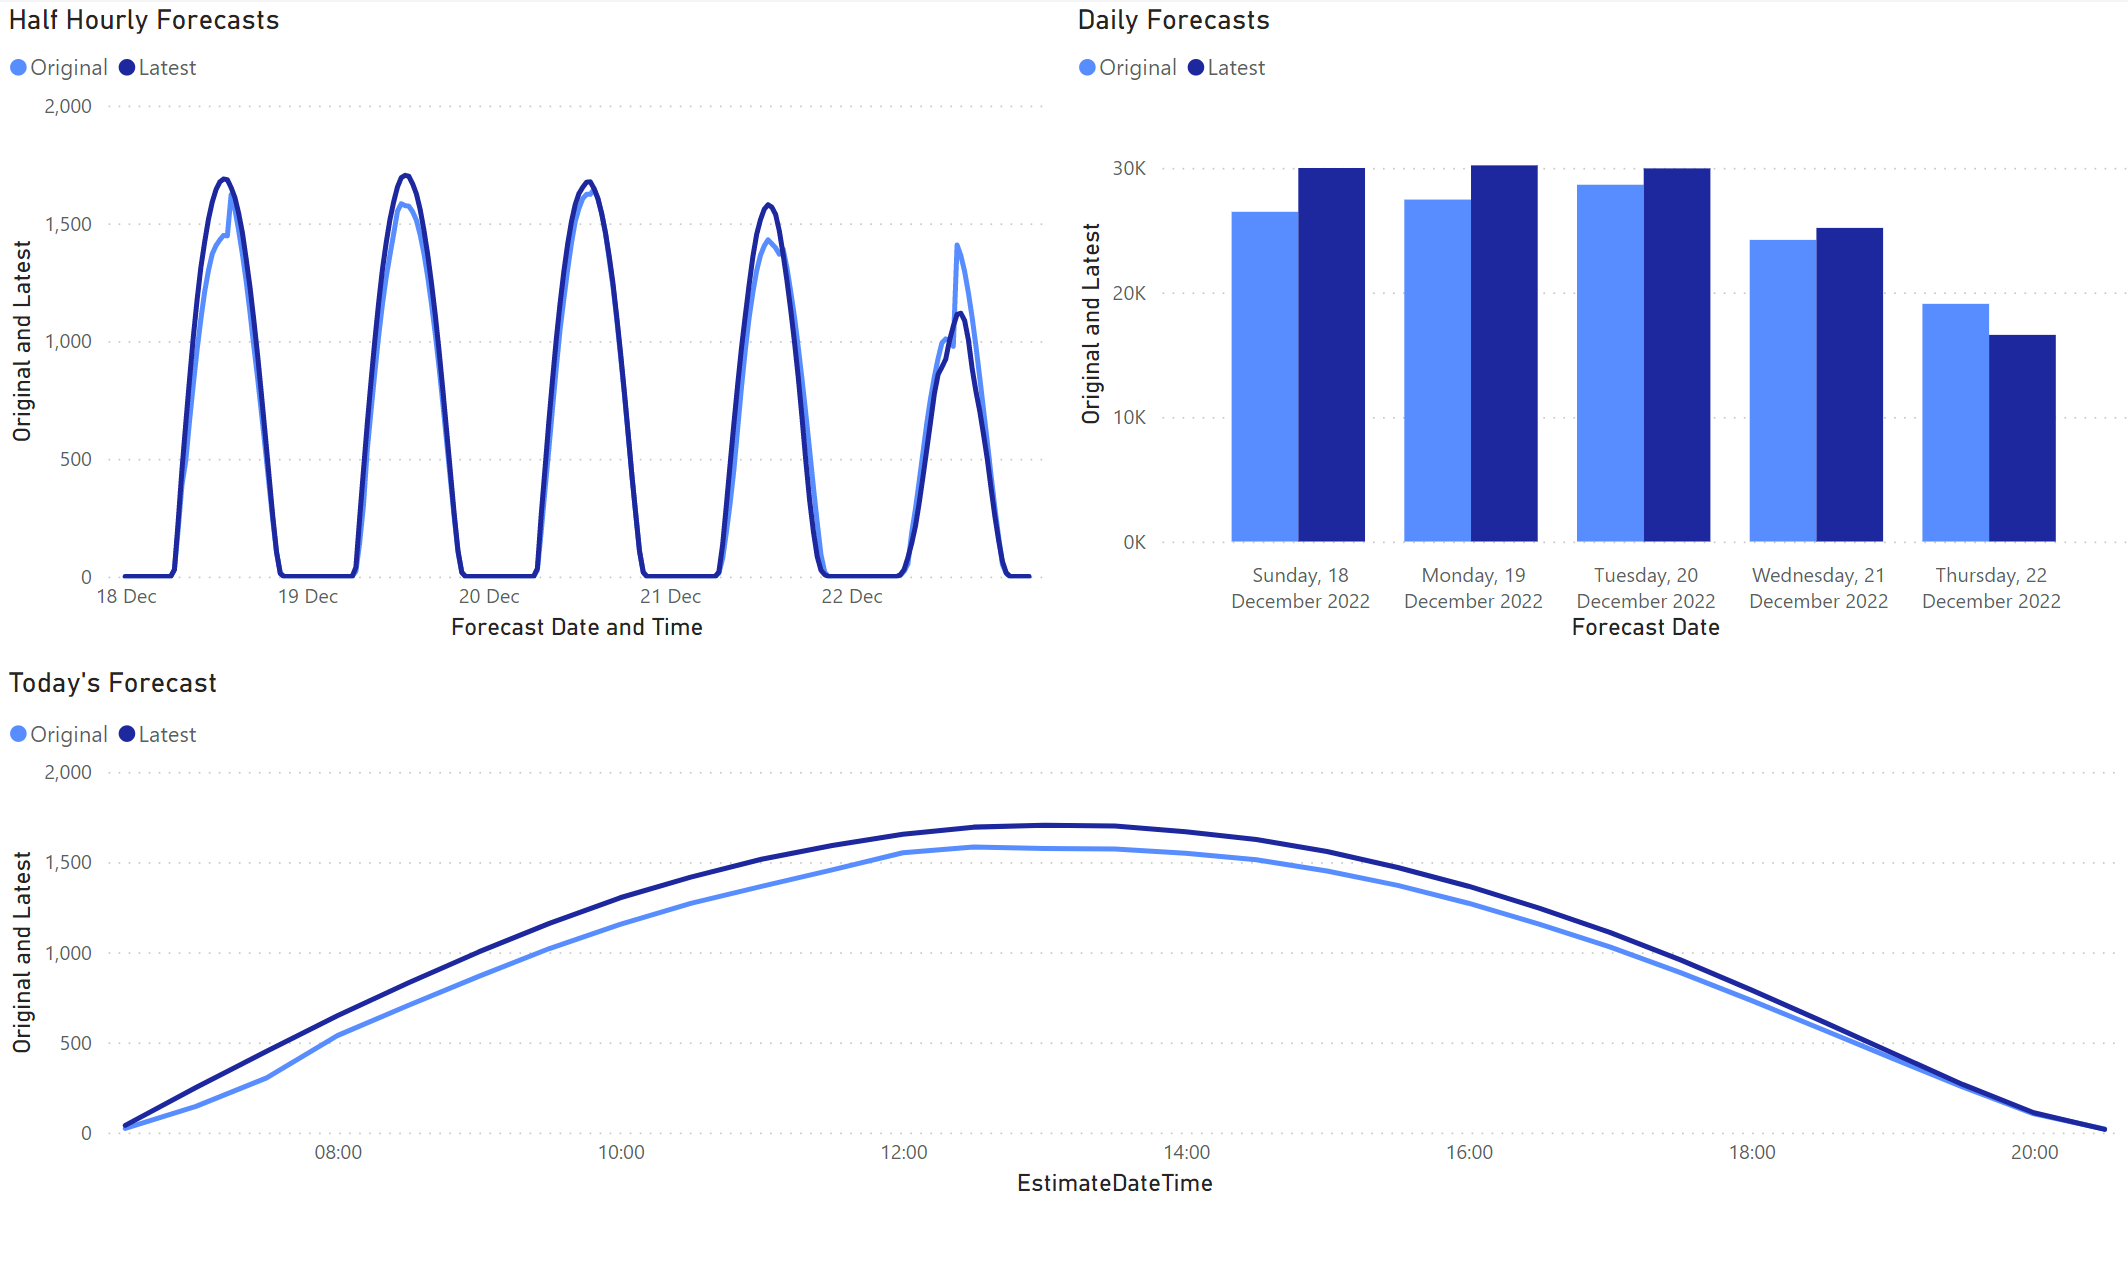
This is what the forecast looks like on another view (I am also pushing the data to PowerBI - where I started pushing six second observations in real time from my Powerwall before I discovered this dashboard):
I stored the earliest iteration of the forecast as well as the latest - it is interesting (at least to me) to see it change over time. So, I have the forecast (in half hourly resolution), and I have a visualisation (in PowerBI, as well in the excellent PVOutput portal). PowerBI gives me a future view. PVOutput gives me a real time view. If I can work out how to get this data into InfluxDB, then presumably I can add it to the dashboard. I'll be happy to share that part. If you can get local, system specific (based on azimuth, elevation and size) output forecasts, your predictions are likely to be much more accurate. What Solcast does is then apply cloud forecasts over the top of that, to really make them incredibly accurate. I use that to determine when to charge (in winter) from the grid so the battery has enough charge to last through peak in the afternoon. It is very rare that I don't charge enough, or charge too much, because the forecasts are accurate enough, and my load forecast is also accurate - but that's another post. |
Beta Was this translation helpful? Give feedback.
-
|
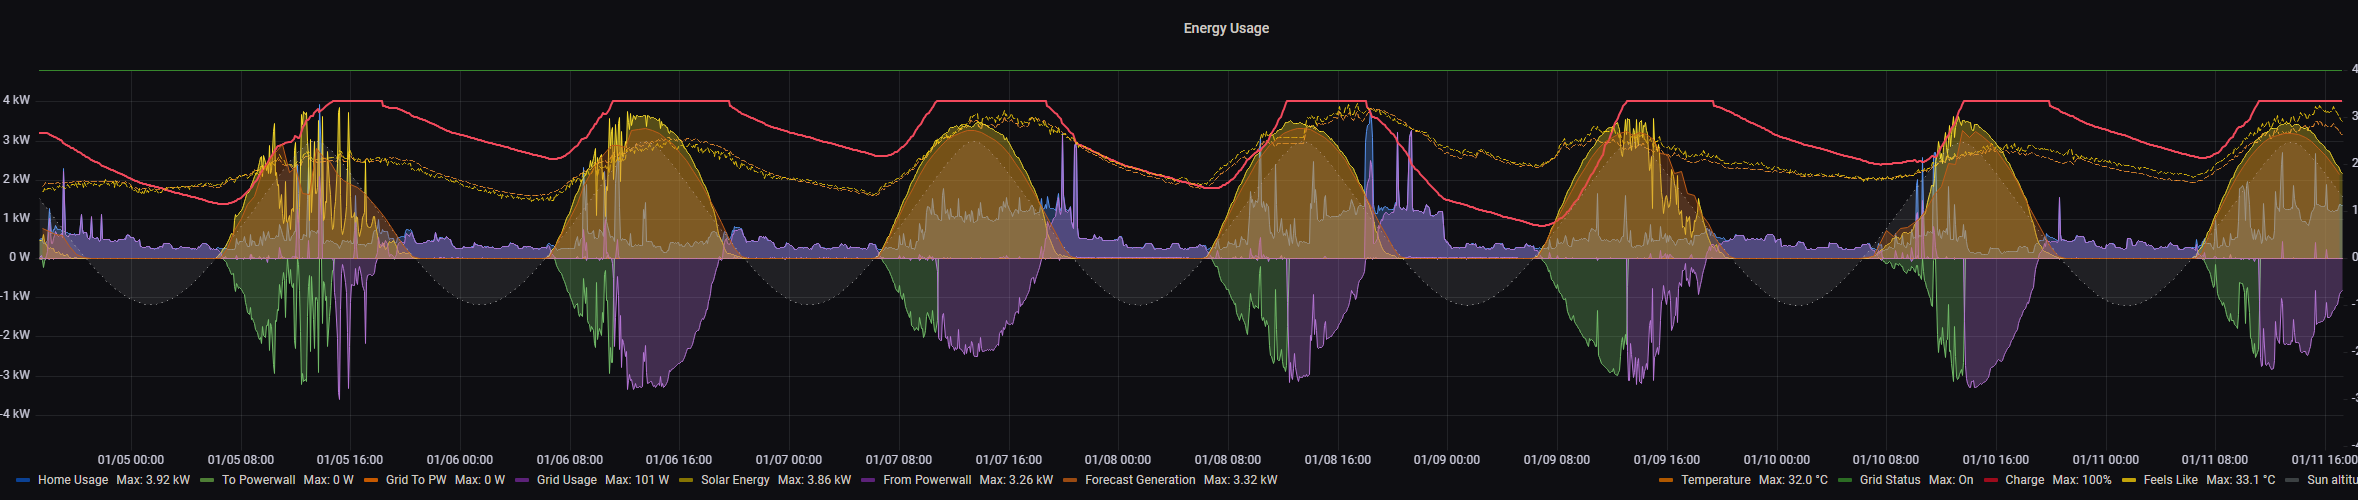
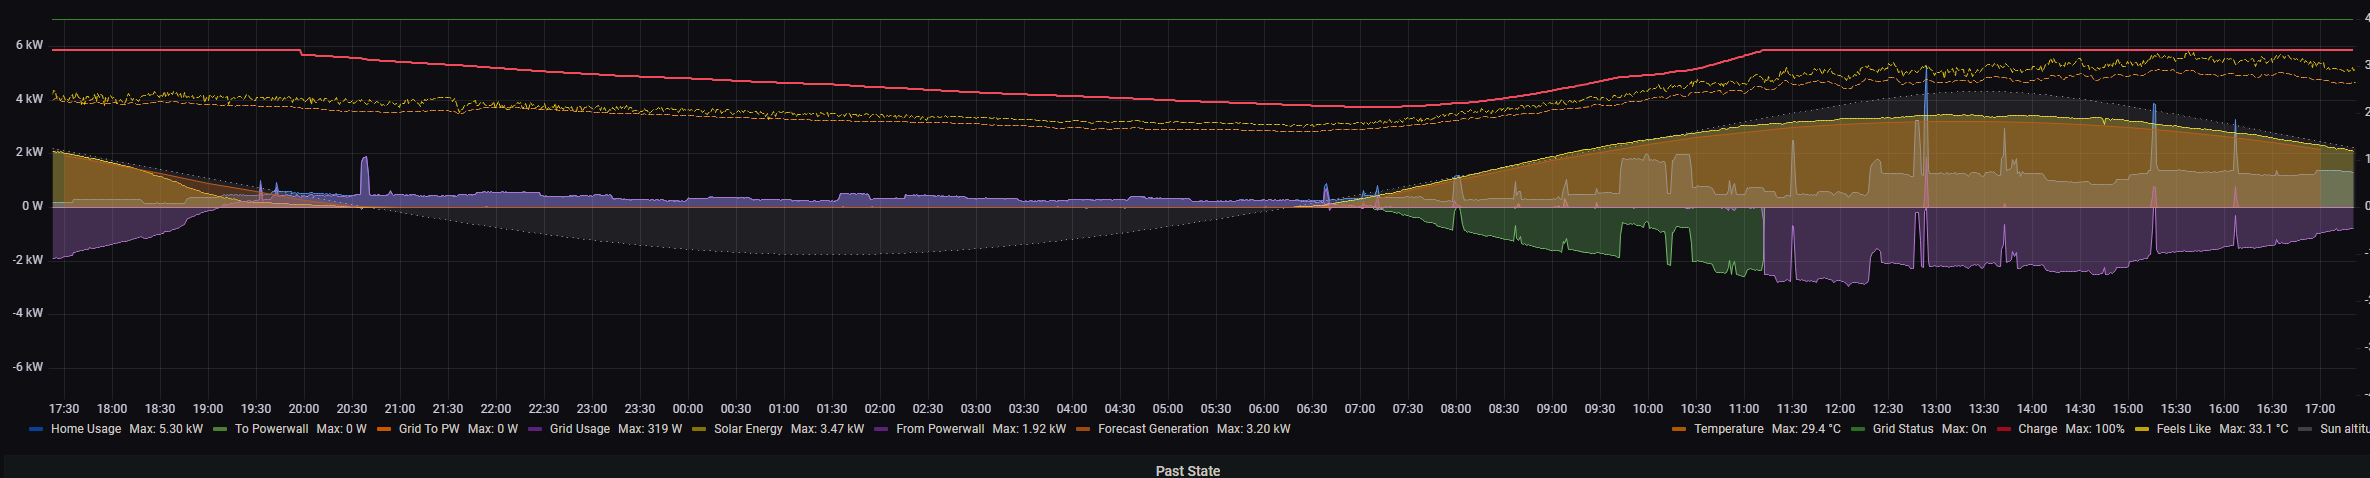
Well, I came back to this after getting my local weather station data into the dashboard, and, for me, it turned out to be incredibly easy, as I'd already done the hard work of getting the data into a database. I've already got a process getting the forecast out of Solcast into an SQL Server, so it was simply a matter of setting up an appropriate SQL Server login - I set up a new read only login, granted db_datareader to the login, created a new data source in grafana, and added a new query to my dashboard. This is what it looks like for 7 days, and for the current 24 hours. The graph is very busy. but it gives you a good idea of the expected insolation. You can see a few cloudy days last week where the shape of the forecast reflects the expected reduction of output. Forecast resolution is 30 minutes. |
Beta Was this translation helpful? Give feedback.
Uh oh!
There was an error while loading. Please reload this page.
-
I wanted to start this post by thanking you for this great dashboard! I've been using it for a few weeks now. My 18.4 KW system has been peaking at around 7KW daily and a max of 9.82 kW... I have a few calls into Tesla about this... everything is "working fine!" Having the extra visibility allowed me to point out an issue with one of the inverters. After resetting it, the production was much higher on the second day (see screenshot below). Without this dashboard, I would have never known that the inverter was not working properly. Tesla said everything looked good.
Anyway, regarding the subject of this discussion: Forecasting / Predicting Charge and Solar Generation
I've been monitoring my charge daily and changing my habits based on the charge rate and once the battery is fully charged. It would be really interesting to forecast when the battery will be fully charged based on the historical data and the current incoming solar generation.
https://community.grafana.com/t/future-forcast-influx-grafana/31014
https://www.influxdata.com/blog/how-to-use-influxdbs-holt-winters-function-for-predictions/
https://docs.influxdata.com/flux/v0.x/stdlib/universe/holtwinters/
https://www.youtube.com/watch?v=hnbHArJ7GhQ
https://grafana.com/blog/2019/02/14/visualizing-the-future-with-grafana/
Here's my system:
Beta Was this translation helpful? Give feedback.
All reactions