Memory profiling the backward pass of a recurrent function #7509
Replies: 1 comment 2 replies
-
|
The Device Memory profiler is capturing the memory usage at the instant that you collected the profiler. Unfortunately that's after the gradient has been computed and any temporaries have been freed. I'm not sure we have any really good tricks for watching memory usage during the backward pass at the moment. The best I can think of is do so something like add a custom VJP (gradient) to one of the operators and dump the memory profile in that. That's hardly ideal, though... |
Beta Was this translation helpful? Give feedback.
-
|
Oh I didn't realize that this was collected after temporary values were freed, that makes sense! Thank you. I tried your suggestion with a custom VJP, and I managed to get something more meaningful now. I just did a custom VJP for the identity function, with the memory profile being dumped during in the bwd function. from jax import custom_vjp
from functools import partial
@partial(custom_vjp, nondiff_argnums=(0,))
def memory_profiler(num_steps, x):
return x
def memory_profiler_fwd(num_steps, x):
return x, ()
def memory_profiler_bwd(num_steps, _, g):
jax.profiler.save_device_memory_profile(f'memory_{num_steps:03d}.prof', backend='cpu')
return (g,)
memory_profiler.defvjp(memory_profiler_fwd, memory_profiler_bwd)And then I just update my function with def rnn(num_steps):
def _rnn_loss(hidden):
+ hidden = memory_profiler(num_steps, hidden)
for i in range(num_steps):
hidden = rnn_cell(hidden)
return hidden.sum() # Dummy loss
return _rnn_lossThe results seem to match what I expected. Here is what I get
And here is the graph for 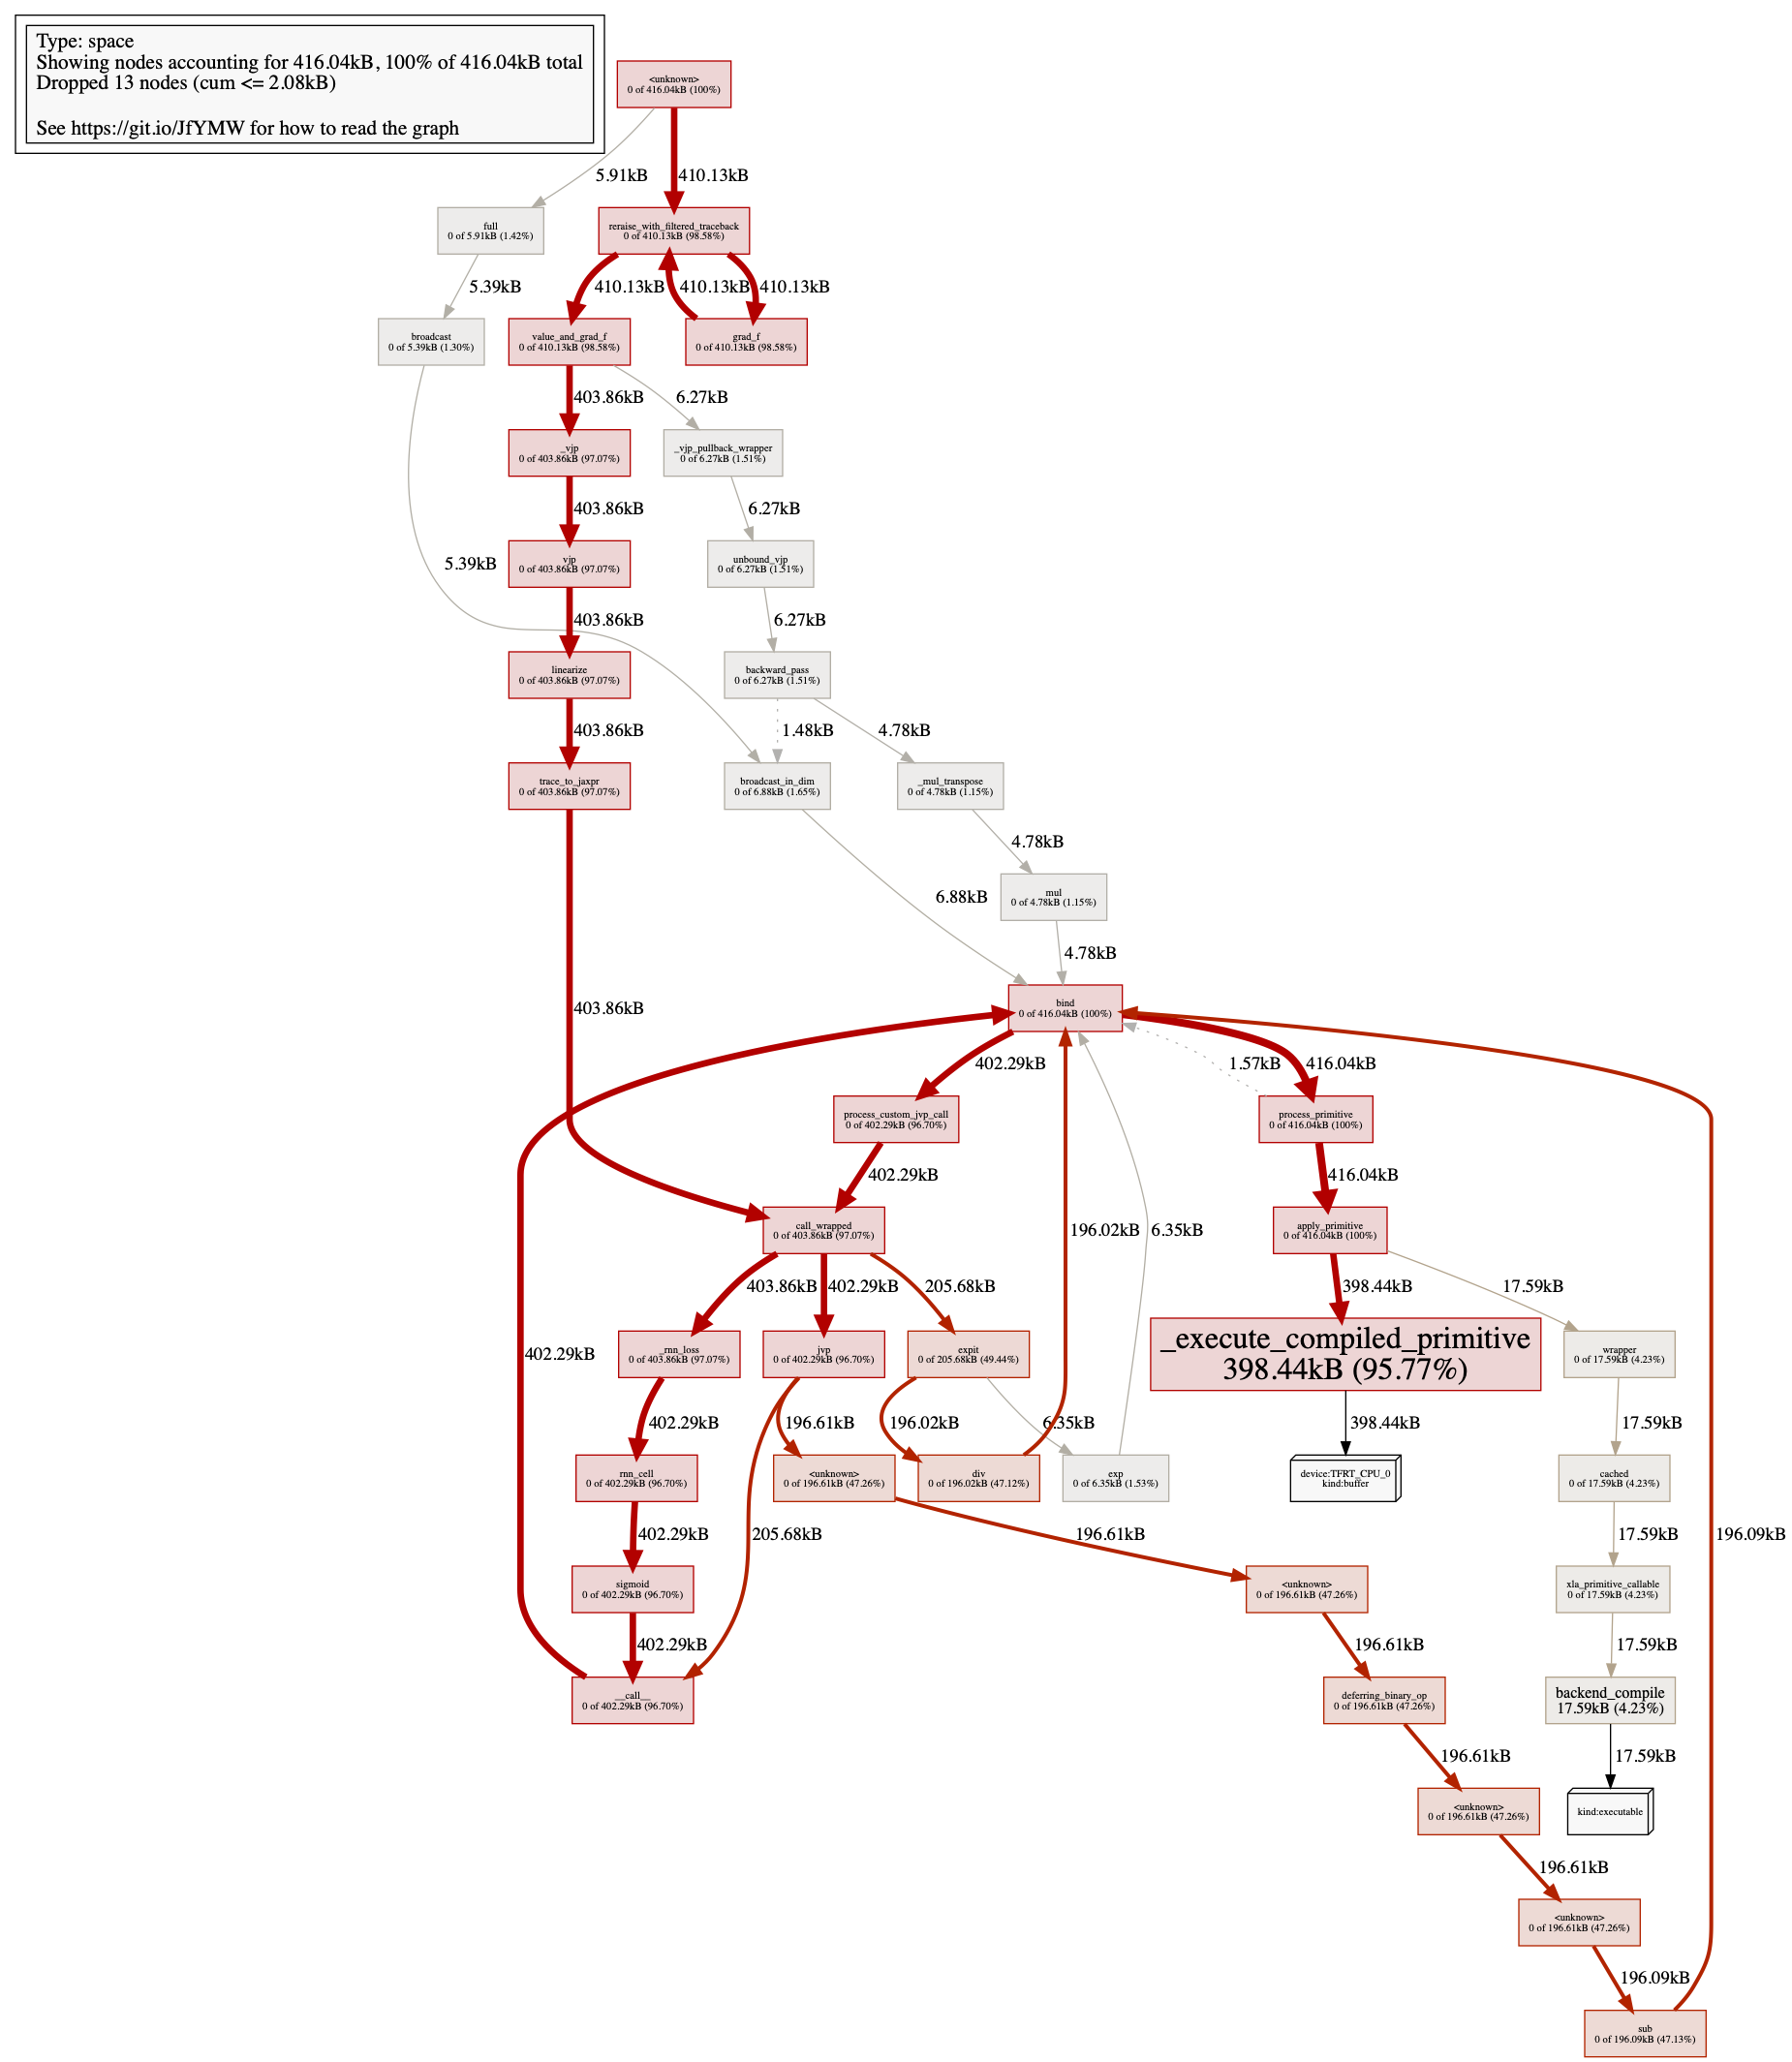
|
Beta Was this translation helpful? Give feedback.
-
|
"The Device Memory profiler is capturing the memory usage at the instant that you collected the profiler. Unfortunately that's after the gradient has been computed and any temporaries have been freed." @hawkinsp Does this apply to tensorflow's tensorboard too? |
Beta Was this translation helpful? Give feedback.
Uh oh!
There was an error while loading. Please reload this page.
-
I am trying to monitor the amount of memory used during the backward pass of a recurrent function, hopefully to see the effect of storing the intermediate values during the forward pass (as explained in the
jax.checkpointdocumentation). For this, I am using the Device Memory Profiler, and checking the graph returned with pprof.I expect the amount of memory allocated when computing
grad(f)to grow linearly with the number of recursive steps in the functionf. However on a simple recursive function, I see a constant amount of memory (here 19968B), regardless of the number of steps (be it 10, 50 or 100). Here is the code I used:And the example of a graph (the same graph is returned regardless of
num_steps):As a sanity check, I tried to only profile the forward pass (without
grad), and storing all the intermediate hidden states (withhiddens.append(hidden)inside_rnn_loss, similar to the Debugging memory leaks section), and I do see the memory increase with the number of steps as expected (49kB for 10 steps, 205kB for 50 steps, 400kB for 100 steps). Interestingly, even if the overall memory used during the backward pass should be similar to the memory allocated by storing all the intermediate results during the forward pass, the latter is larger by a significant margin (compared to the 19kB in the graph above).Is the Device Memory Profiler the right tool for getting the overall amount of memory used during the backward pass?
Beta Was this translation helpful? Give feedback.
All reactions