Gradient plot is ok? #8146
Replies: 1 comment 6 replies
-
|
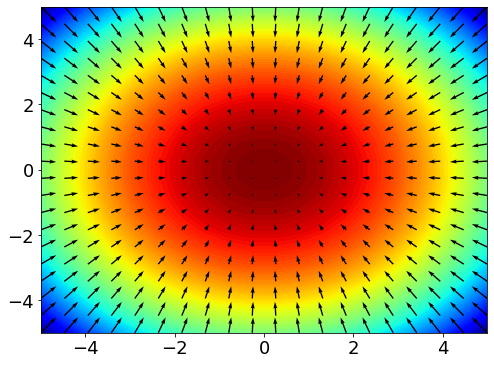
I don't think your function is returning the gradients that you think it is: import jax.numpy as jnp
import jax
import matplotlib.pyplot as plt
f = lambda x, y: -(x ** 2 + y ** 2)
x, y = jnp.mgrid[-5:5:20j,-5:5:20j]
z = f(x, y)
grad_x = jax.vmap(jax.vmap(jax.grad(f, argnums=0)))(x, y)
grad_y = jax.vmap(jax.vmap(jax.grad(f, argnums=1)))(x, y)
fig, ax = plt.subplots(figsize=(8, 6))
ax.contourf(x, y, z, levels=100)
ax.quiver(x, y, grad_x, grad_y)
|
Beta Was this translation helpful? Give feedback.
-
|
Ah, I see: in the notebook, the first input contains pairs of import jax.numpy as jnp
import jax
import matplotlib.pyplot as plt
x, y = jnp.mgrid[-5:5:20j,-5:5:20j]
points = jnp.vstack([x.ravel(), y.ravel()]).T
f = lambda p: -(p[0] ** 2 + p[1] ** 2)
z, gradient = jax.vmap(jax.value_and_grad(f))(points)
fig, ax = plt.subplots(figsize=(8, 6))
ax.contourf(x, y, z.reshape(x.shape), levels=100)
ax.quiver(points[:, 0], points[:, 1], gradient[:, 0], gradient[:, 1])I would compare this logic to the logic in your own example to see where the quiver gradients are going wrong. |
Beta Was this translation helpful? Give feedback.
-
|
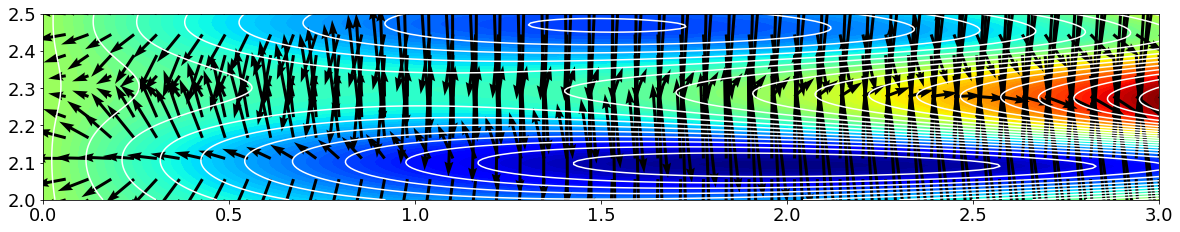
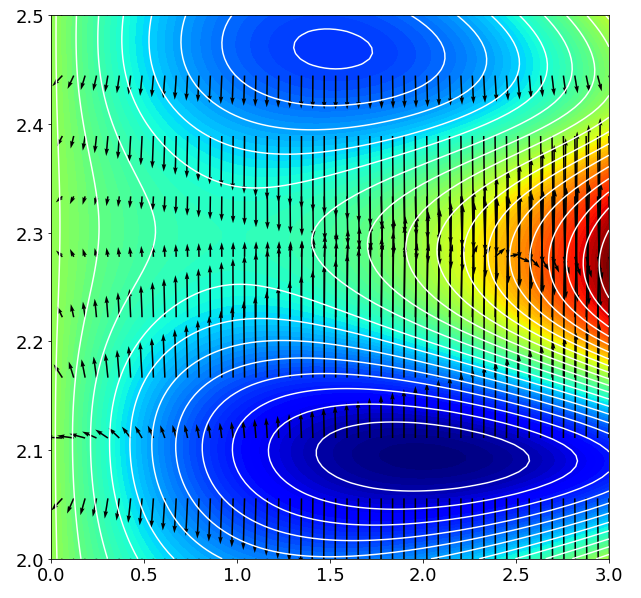
Actually, looking again I don't think there's anything wrong with your gradients: the issue is the aspect ratio of your charts. The data axis ratio of your plot is about 6:1, which can make it so that vector gradient representations don't visually line up with the gradient shown by the contours. You should try plotting your function with an axis ratio of 1: plt.gca().set_aspect(1)When I do this for your chart, the gradients appear consistent with the contours: |
Beta Was this translation helpful? Give feedback.
-
|
humm... def jax_gradhess(model,p,xdata,ydata):
print("pt:",p)
print("jax grad:",jax.jacfwd(model)(p,xdata,ydata))
print("jax hess:\n",jax.hessian(model)(p,xdata,ydata))
def fdiff_gradhess(model,p,xdata,ydata,h=0.01):
print("pt:",p)
f11 = lambda h1,h2:model(p+h1*np.array([1,0])+h2*np.array([0,1]),xdata,ydata)
f10 = lambda h: f11(h,0.)
f01 = lambda h: f11(0.,h)
gxx = (f10(h)-f10(-h))/(2*h)
gyy = (f01(h)-f01(-h))/(2*h)
print("df. grad:", np.array([gxx,gyy]))
hxx = (-f10(2*h)+16*f10(h)-30*f10(0.)+16*f10(-h)-f10(-2*h))/(12*h**2)
hyy = (-f01(2*h)+16*f01(h)-30*f01(0.)+16*f01(-h)-f01(-2*h))/(12*h**2)
hxy = hyx = (f11(h,h)-f11(h,-h)-f11(-h,h)+f11(-h,-h))/(4*h**2)
print("df. hess:\n",np.array([[hxx,hxy],[hyx,hyy]]))
pt = np.array(nllik_model.x)
jax_gradhess(nl_lik,pt,xi,yi)
fdiff_gradhess(nl_lik,pt,xi,yi,h=0.00001)I got a correct agreement of jax gradient/hessian compare to Finite Differenc central approx so the problem is localised is this part ? grid = np.mgrid[0.0:3.0:50j,2.0:2.5:10j]
points = np.swapaxes(grid,0,-1).reshape(-1,2)
gradients = jax.vmap(
jax.grad(
lambda p,x,y: nl_lik(p,x,y)
), in_axes = (0,None,None)
)(points,xi,yi) |
Beta Was this translation helpful? Give feedback.
-
|
I think our comments crossed - I believe your gradients are correct, but the chart aspect ratio results in a misleading visualization. See my previous comment. |
Beta Was this translation helpful? Give feedback.
-
|
oh ! Yes I see, I have made some test and you certainly put the finger in the right spot. Thanks. Now when I have very quite assymetric range the plot is not so nice so I do not now if one has a fix... Anyhow, Thanks for your help. |
Beta Was this translation helpful? Give feedback.
Uh oh!
There was an error while loading. Please reload this page.
-
Hi, here is a snippet on the usage of jax.vmap and jax.grad to get a gradient flow as well as contour plots on top of each other
The result looks strange to me
as I would have expected the arrow to be orthogonal to contour levels. I'm wrong somewhere ?
Thanks
Beta Was this translation helpful? Give feedback.
All reactions