Failed to see trace in Jaeger UI #6434
-
|
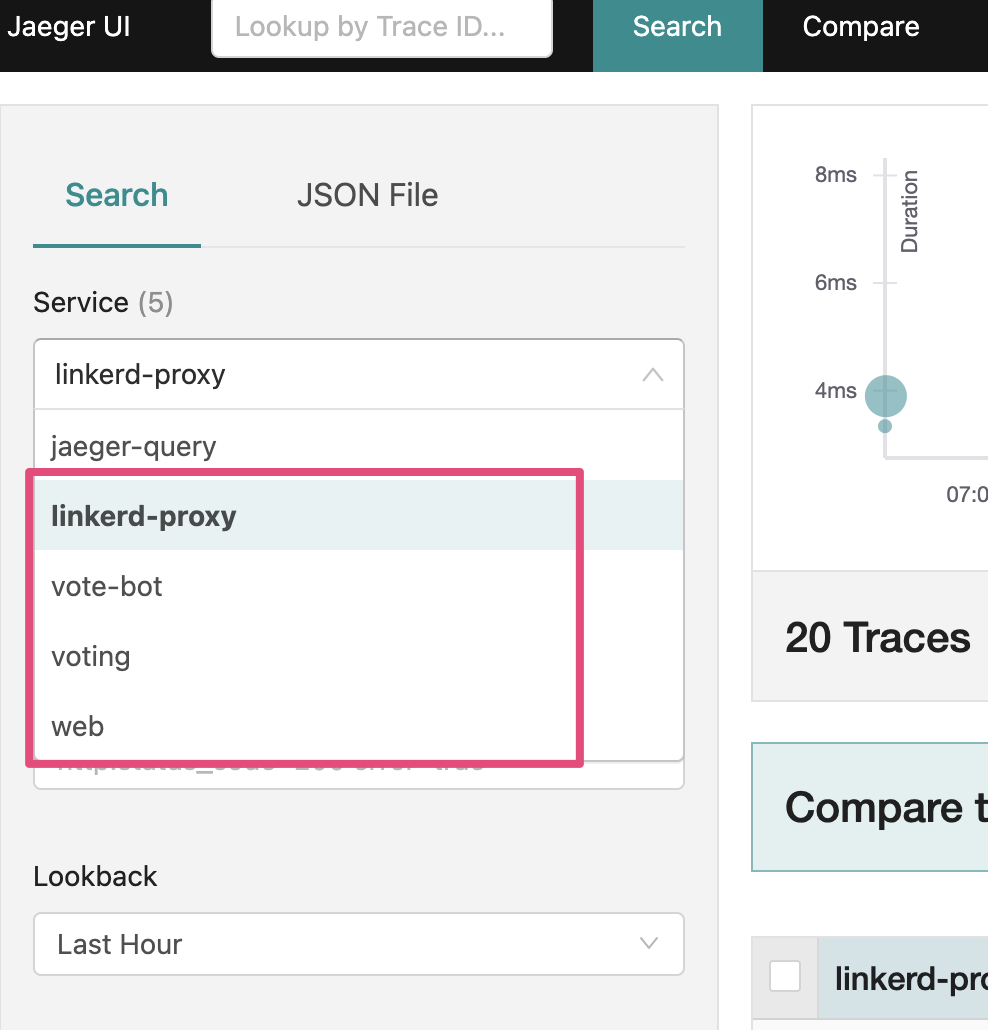
I am using Linkerd. I am trying to show trace in Jaeger UI. I have read these related issues, but none of them has accepted answers: Following the Linkerd tracing tutorial which uses 1. emojivoto AppFor the demo app emojivoto, after running linkerd inject https://run.linkerd.io/emojivoto.yml | kubectl apply -f -I can see Then after set env by kubectl -n emojivoto set env --all deploy OC_AGENT_HOST=collector.linkerd-jaeger:55678I can see all server services
2. My appBased on My project has this structure:
I am using annotations:
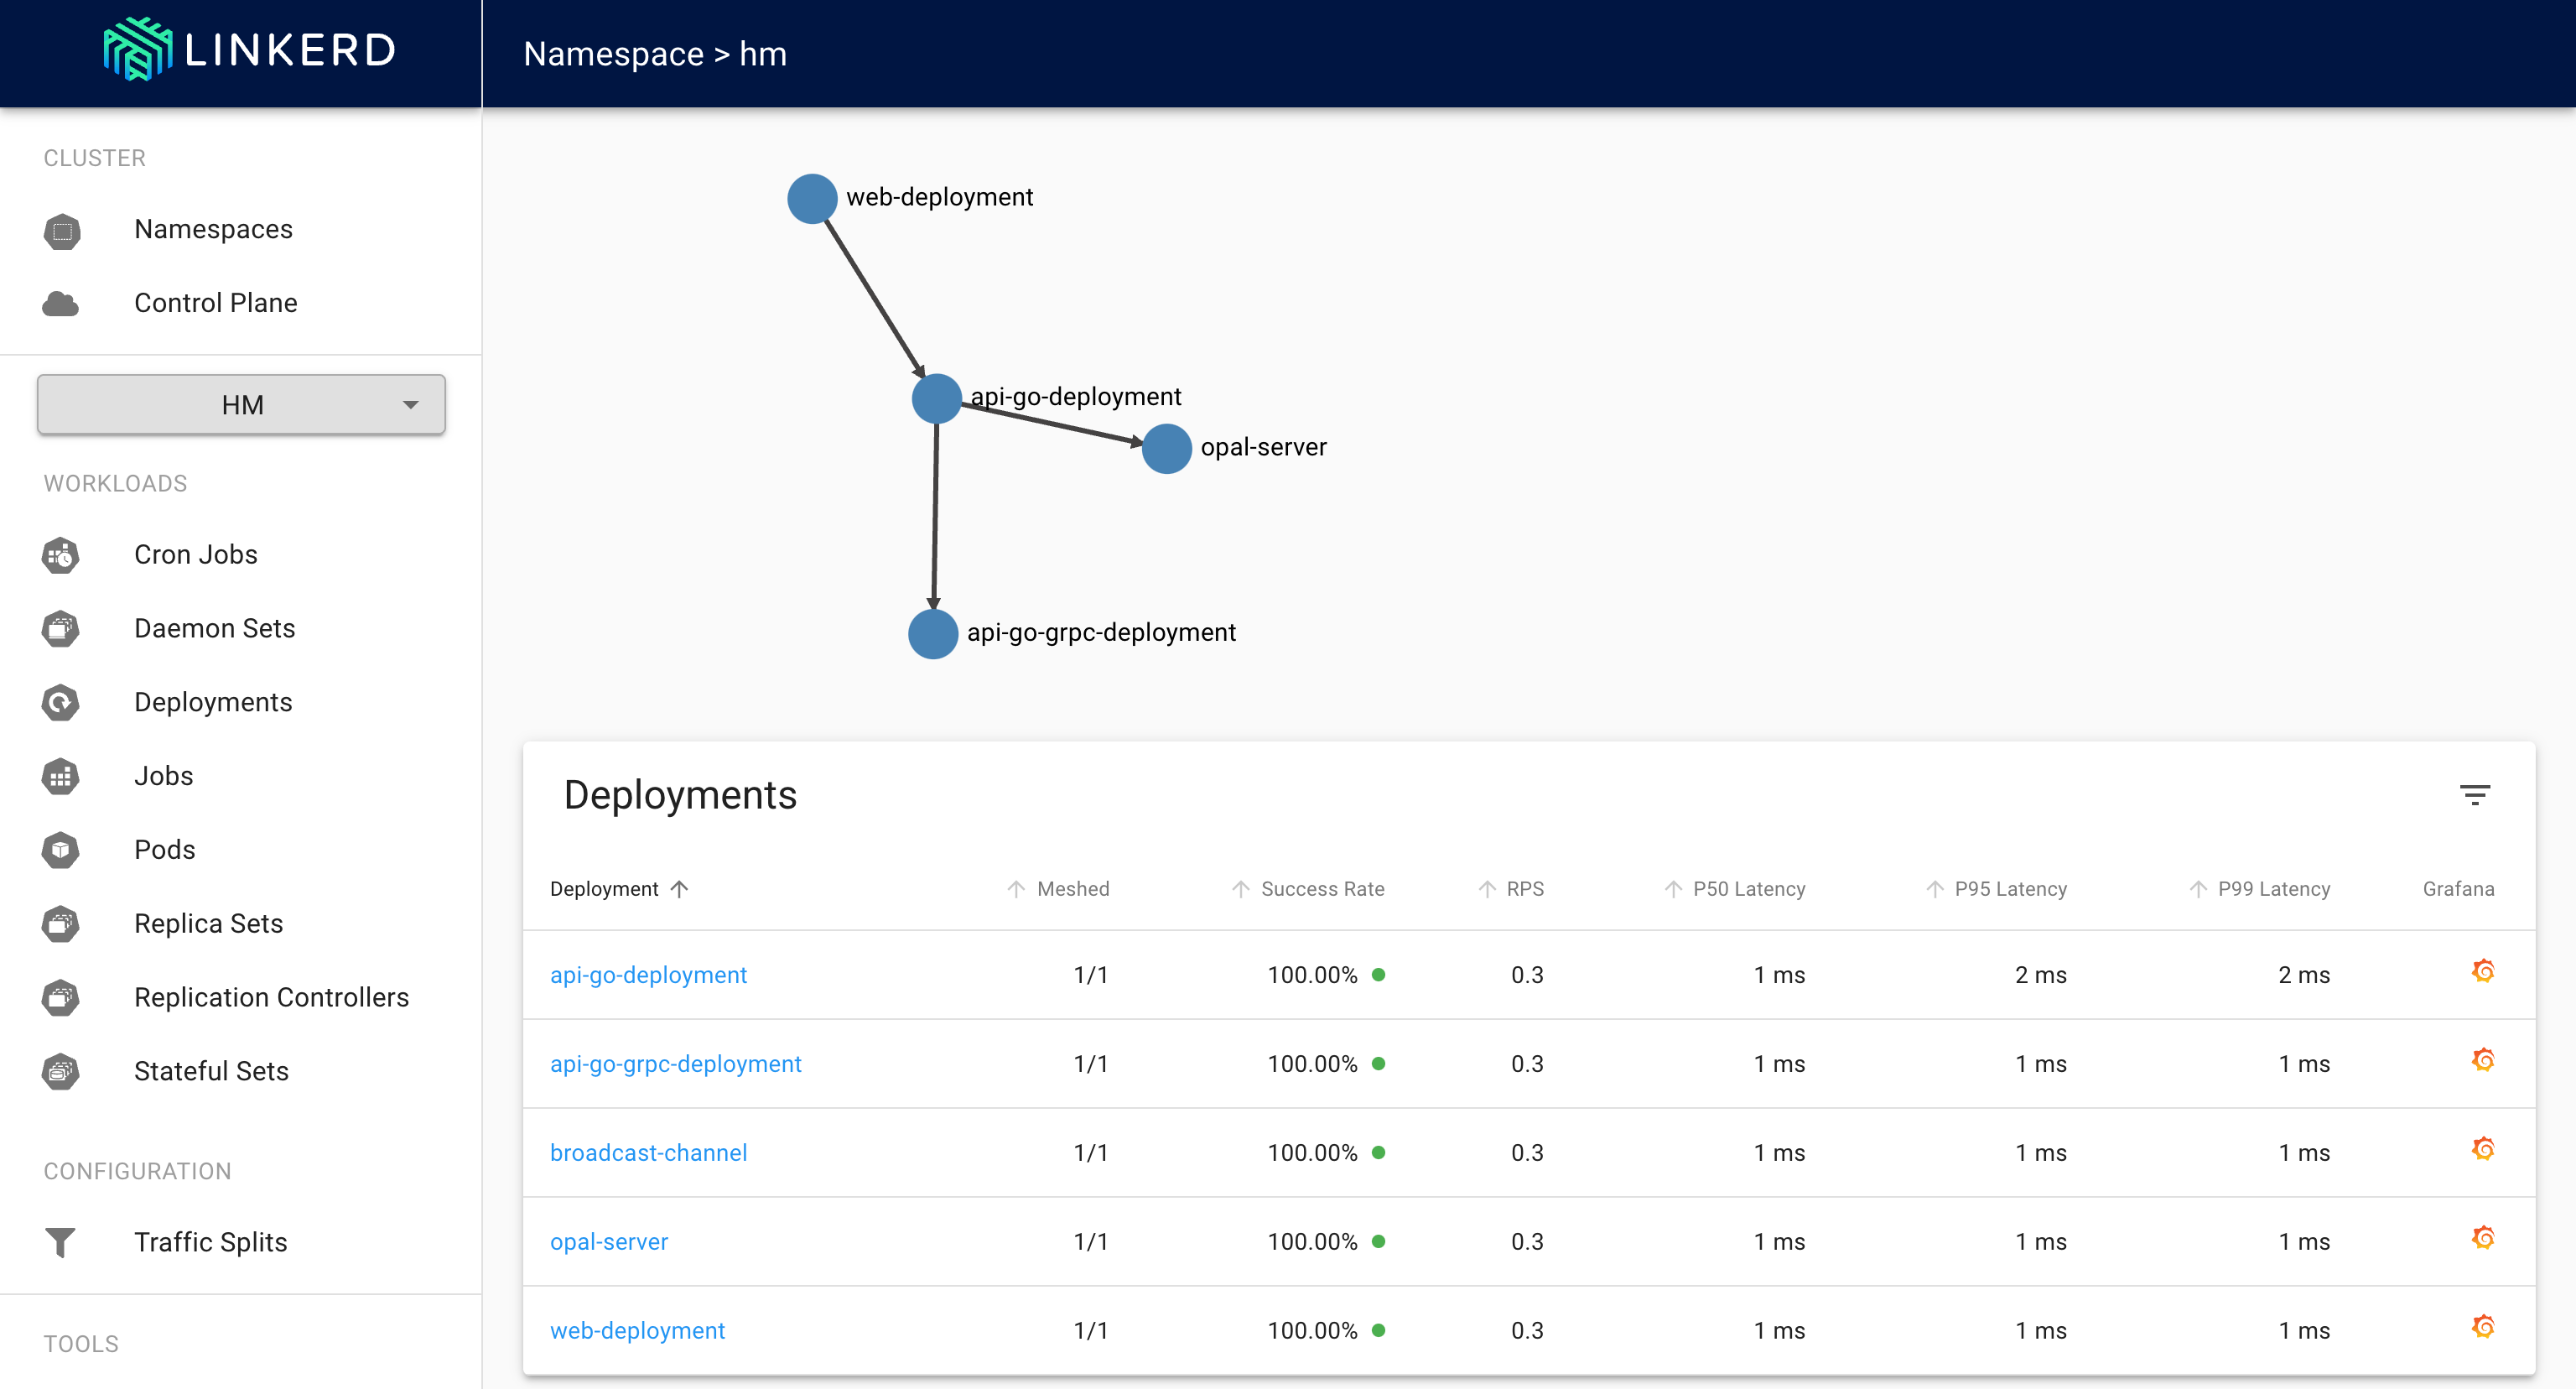
linkerd.io/inject: enabledfor each my deployment yaml file such as this After I start my app, all deployments successfully got meshed, and you can see my project traffic in the screenshot:
Based on emojivoto's commit that adding trace, below are my codes (basically just copy and paste from emojivoto): I have this block of codes in my GPRC server oce, err := ocagent.NewExporter(
ocagent.WithInsecure(),
ocagent.WithReconnectionPeriod(5*time.Second),
ocagent.WithAddress(config.OpenCensusAgentHost+":"+config.OpenCensusAgentPort), // this is "collector.linkerd-jaeger:55678" which also prints in my log
ocagent.WithServiceName("api-go-grpc"))
if err != nil {
log.Error().Err(err).Msg("ocagent.NewExporter")
}
trace.RegisterExporter(oce)
lis, err := net.Listen("tcp", ":"+config.GRPCPort)
if err != nil {
log.Error().Err(err).Msg("net.Listen")
}
s := grpc.NewServer(grpc.StatsHandler(&ocgrpc.ServerHandler{}))Also, I have this block of codes in my API Go (Gin) server oce, err := ocagent.NewExporter(
ocagent.WithInsecure(),
ocagent.WithReconnectionPeriod(5*time.Second),
ocagent.WithAddress(config.OpenCensusAgentHost+":"+config.OpenCensusAgentPort), // this is "collector.linkerd-jaeger:55678" which also prints in my log
ocagent.WithServiceName("api-go"))
if err != nil {
log.Error().Err(err).Msg("ocagent.NewExporter")
}
trace.RegisterExporter(oce)
r := routes.SetupRouter()
_ = http.ListenAndServe(
":"+config.Port,
&ochttp.Handler{
Handler: r,
},
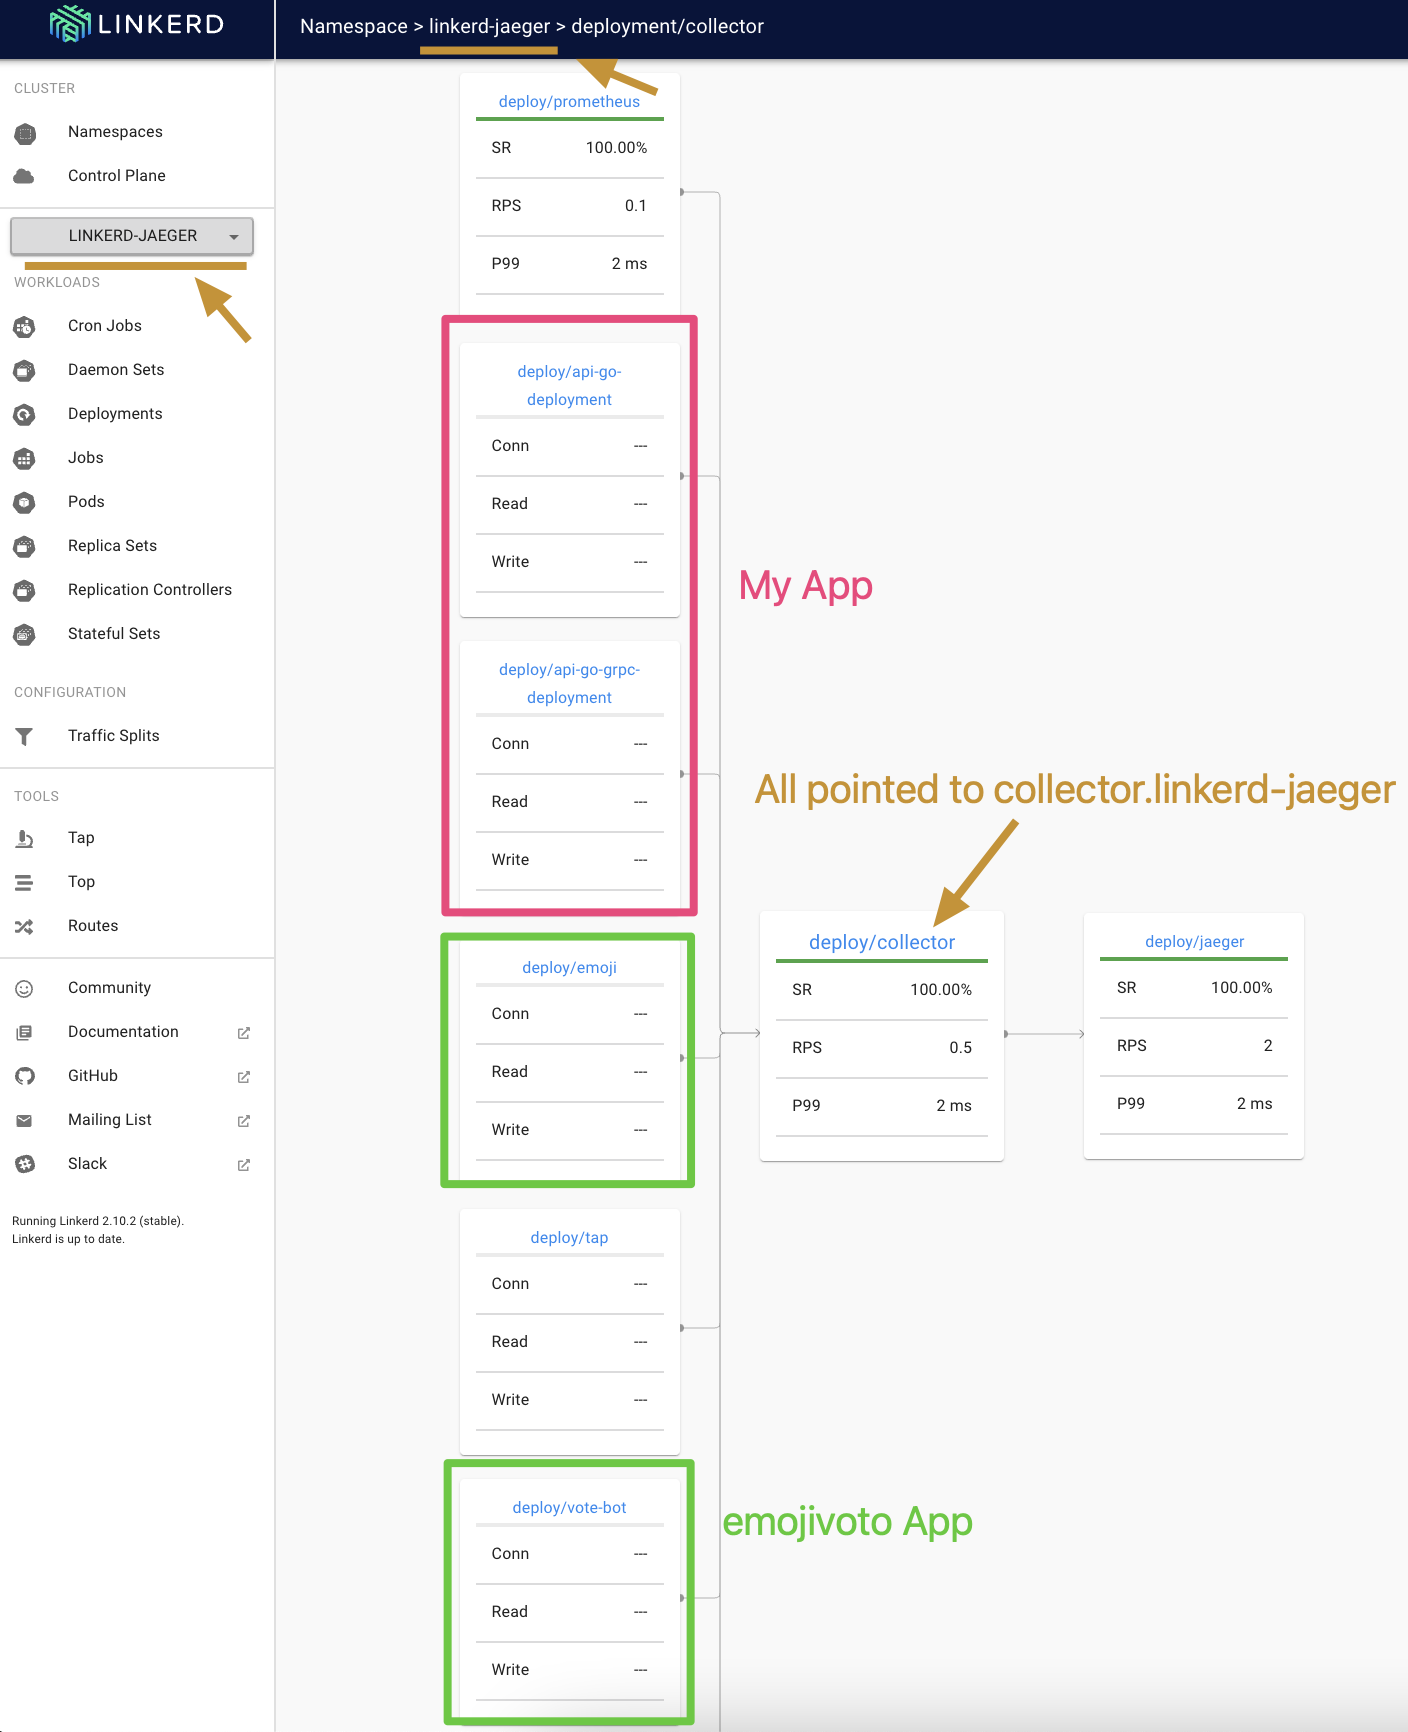
)Both OpenCensus Agent addresses are Also, the Linkerd screenshot below can double confirm my servers are pointing to
However, if I only deploy my app (not together with Any guide to help further debug will be appreciated. Thanks! |
Beta Was this translation helpful? Give feedback.
Replies: 1 comment 13 replies
-
|
@hongbo-miao do you have an ingress configured? The Linkerd distributed tracing mechanism expects that a trace has been started, and the proxy will add the span ID to the existing trace ID. If there is no trace initiated, then you won't see any spans connected together. That being said, I'd expect that the Jaeger UI would show several traces without span IDs. |
Beta Was this translation helpful? Give feedback.
-
It looks like the nginx ingress controller was properly injected with the Linkerd proxy. Did you follow the instructions to enable opentracing in the ingress? I don't see the annotation in the ingress definition in the repo that you linked. |
Beta Was this translation helpful? Give feedback.
-
|
Thanks for the enable opentracing doc link! I wasn't aware of that before. After ingress controller was properly injected with the Linkerd proxy. I patched my kubectl patch configmap ingress-nginx-controller --namespace=ingress-nginx --patch "$(cat ingress-nginx-controller-configmap-patch.yaml)"ingress-nginx-controller-configmap-patch.yaml: apiVersion: v1
kind: ConfigMap
metadata:
name: ingress-nginx-controller
namespace: ingress-nginx
data:
enable-opentracing: "true"
jaeger-collector-host: collector.linkerd-jaeger.svc.cluster.local
# if I use "jaeger-collector-host: jaeger-agent.default.svc.cluster.local"
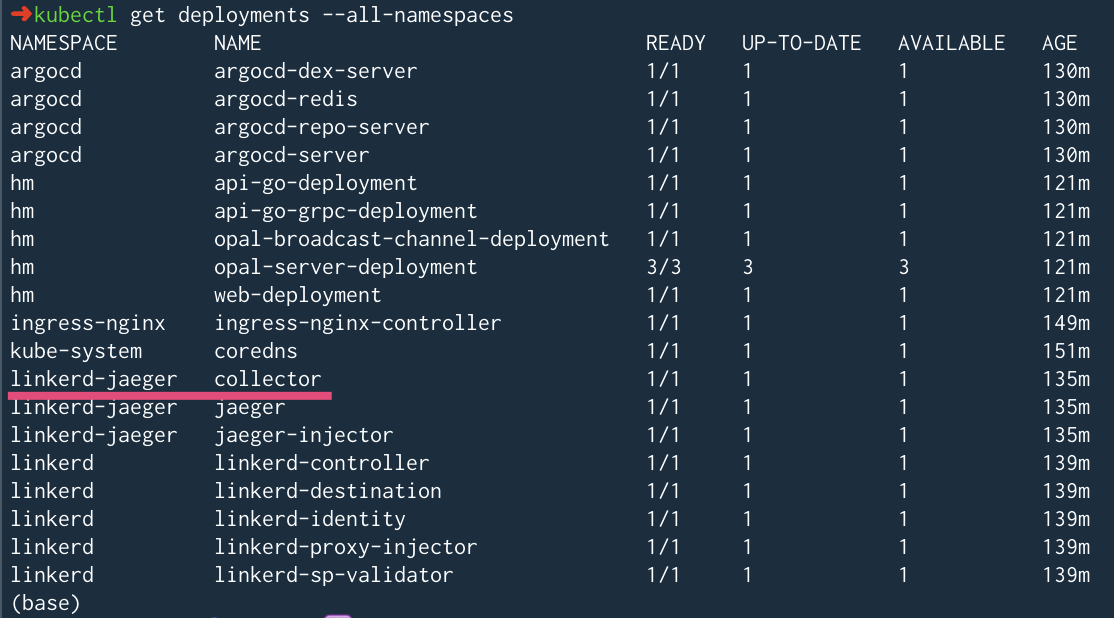
# it will fail later when apply my Ingress yaml fileThe doc is using Here is my deployments:
So I updated to The doc says
Currently I am using (I will ask some of my coworkers who has done Jaeger and Ingress work without service mesh for help too see if they can spot some errors) |
Beta Was this translation helpful? Give feedback.
-
|
@hongbo-miao, the Linkerd distributed tracing docs use the That being said, the I've never tried that myself, and since you're working through this PoC, I suggest sticking with the zipkin collector as outlined in the Linkerd docs. |
Beta Was this translation helpful? Give feedback.
-
|
Ah, it is using jaeger-all-in-one inside! Thanks for the info. In future, I will change to external Jaeger instance and OpenTelemetry for further experiment. Will share back for how I make it. 😀 Thanks @cpretzer for support all time!
|
Beta Was this translation helpful? Give feedback.
-
|
@hongbo-miao great to hear that you've got it working now. The change to use OpenTelemetry is already in the edge releases thanks to this PR. Regarding the |
Beta Was this translation helpful? Give feedback.
@hongbo-miao do you have an ingress configured? The Linkerd distributed tracing mechanism expects that a trace has been started, and the proxy will add the span ID to the existing trace ID.
If there is no trace initiated, then you won't see any spans connected together. That being said, I'd expect that the Jaeger UI would show several traces without span IDs.