Replies: 1 comment
-
|
Not yet, at least not without directly editing the code. |
Beta Was this translation helpful? Give feedback.
0 replies
Sign up for free
to join this conversation on GitHub.
Already have an account?
Sign in to comment
Uh oh!
There was an error while loading. Please reload this page.
-
Was wondering, if you can change how (and especially where) numbers in a chartists type graph (The line graph) are displayed.
Right now one of the SVGs for stragazers looks something like this:
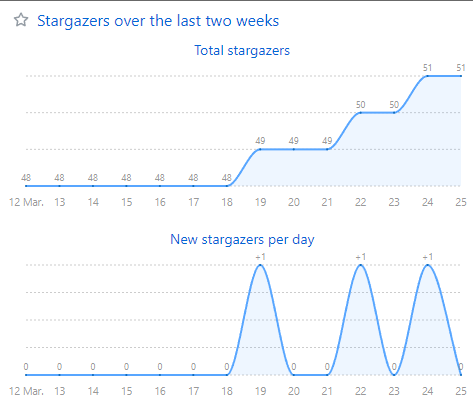
While it's nice, would I like to put the numbers on the left side of the graph for a more general overview.
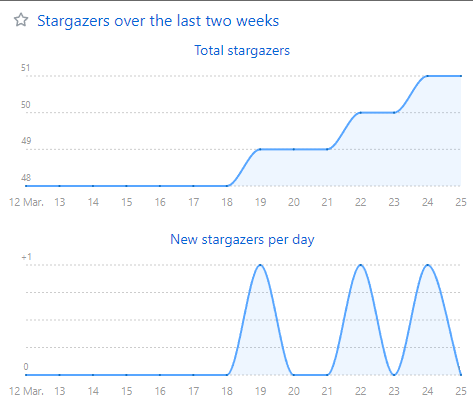
Mockup-example:
Is there already an option for this?
Beta Was this translation helpful? Give feedback.
All reactions