Monitoring is the continuous process of collecting, analyzing, and visualizing system and application data to ensure reliability, performance, and availability. In a DevOps environment, monitoring plays a critical role in maintaining system stability, detecting failures early, and supporting continuous improvement.
It enables teams to observe system behavior in real time, respond quickly to incidents, and make data-driven decisions.
Monitoring helps teams:
- Detect issues before users are affected
- Maintain uptime and availability
- Measure performance and resource usage
- Support incident response and root cause analysis
- Ensure compliance with Service Level Agreements (SLAs)
- Plan capacity and scaling effectively
Without monitoring, systems operate without visibility, making it difficult to detect performance degradation or failures in time.


Infrastructure monitoring focuses on tracking the health and performance of physical or virtual infrastructure.
It includes:
- CPU usage
- Memory consumption
- Disk usage
- Network traffic
- Server uptime
This type of monitoring is essential for cloud environments, virtual machines, containers, and Kubernetes clusters.
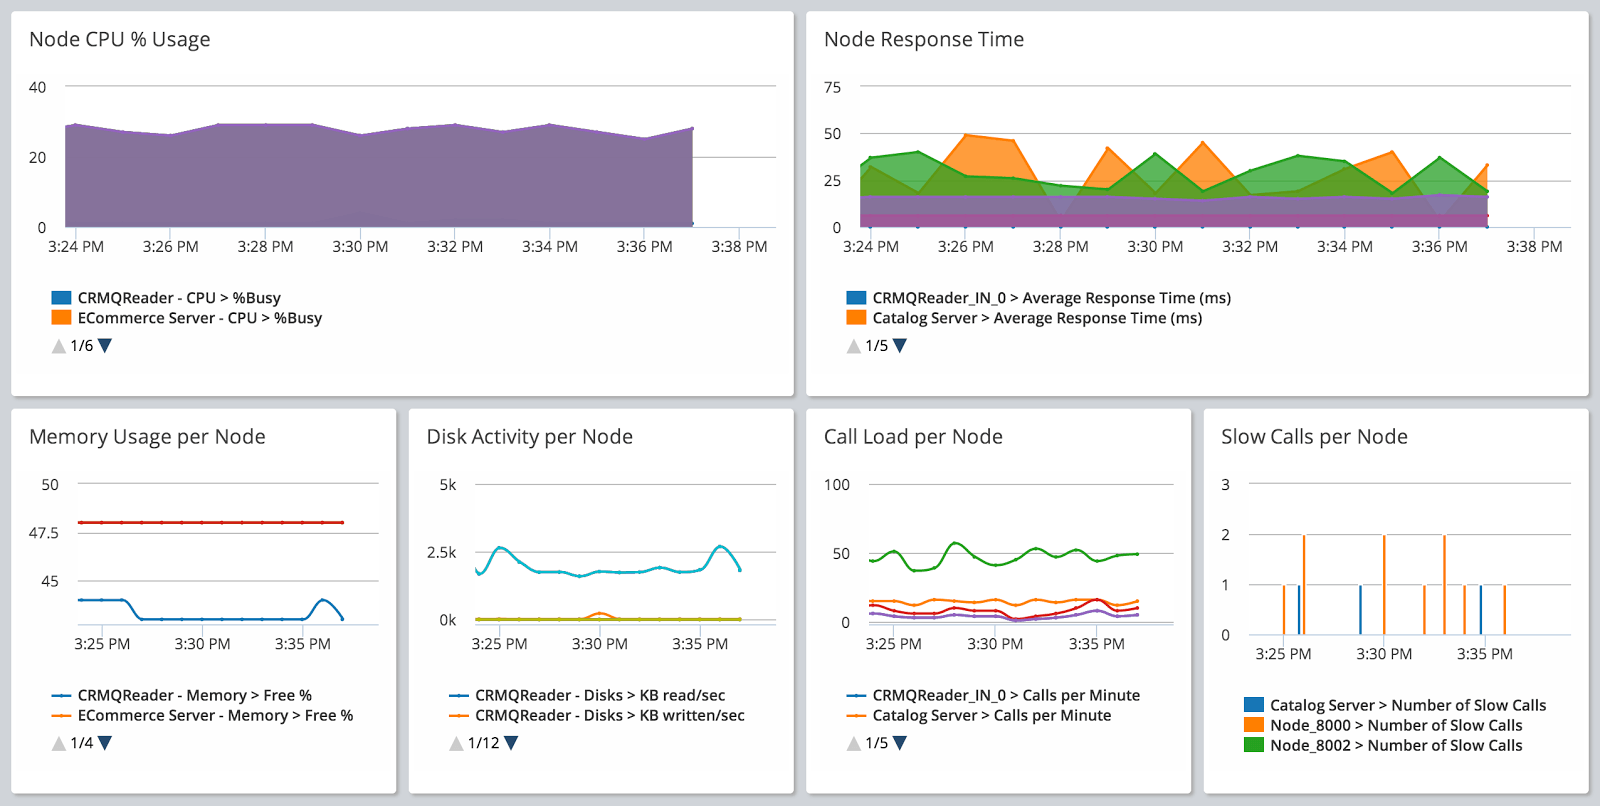
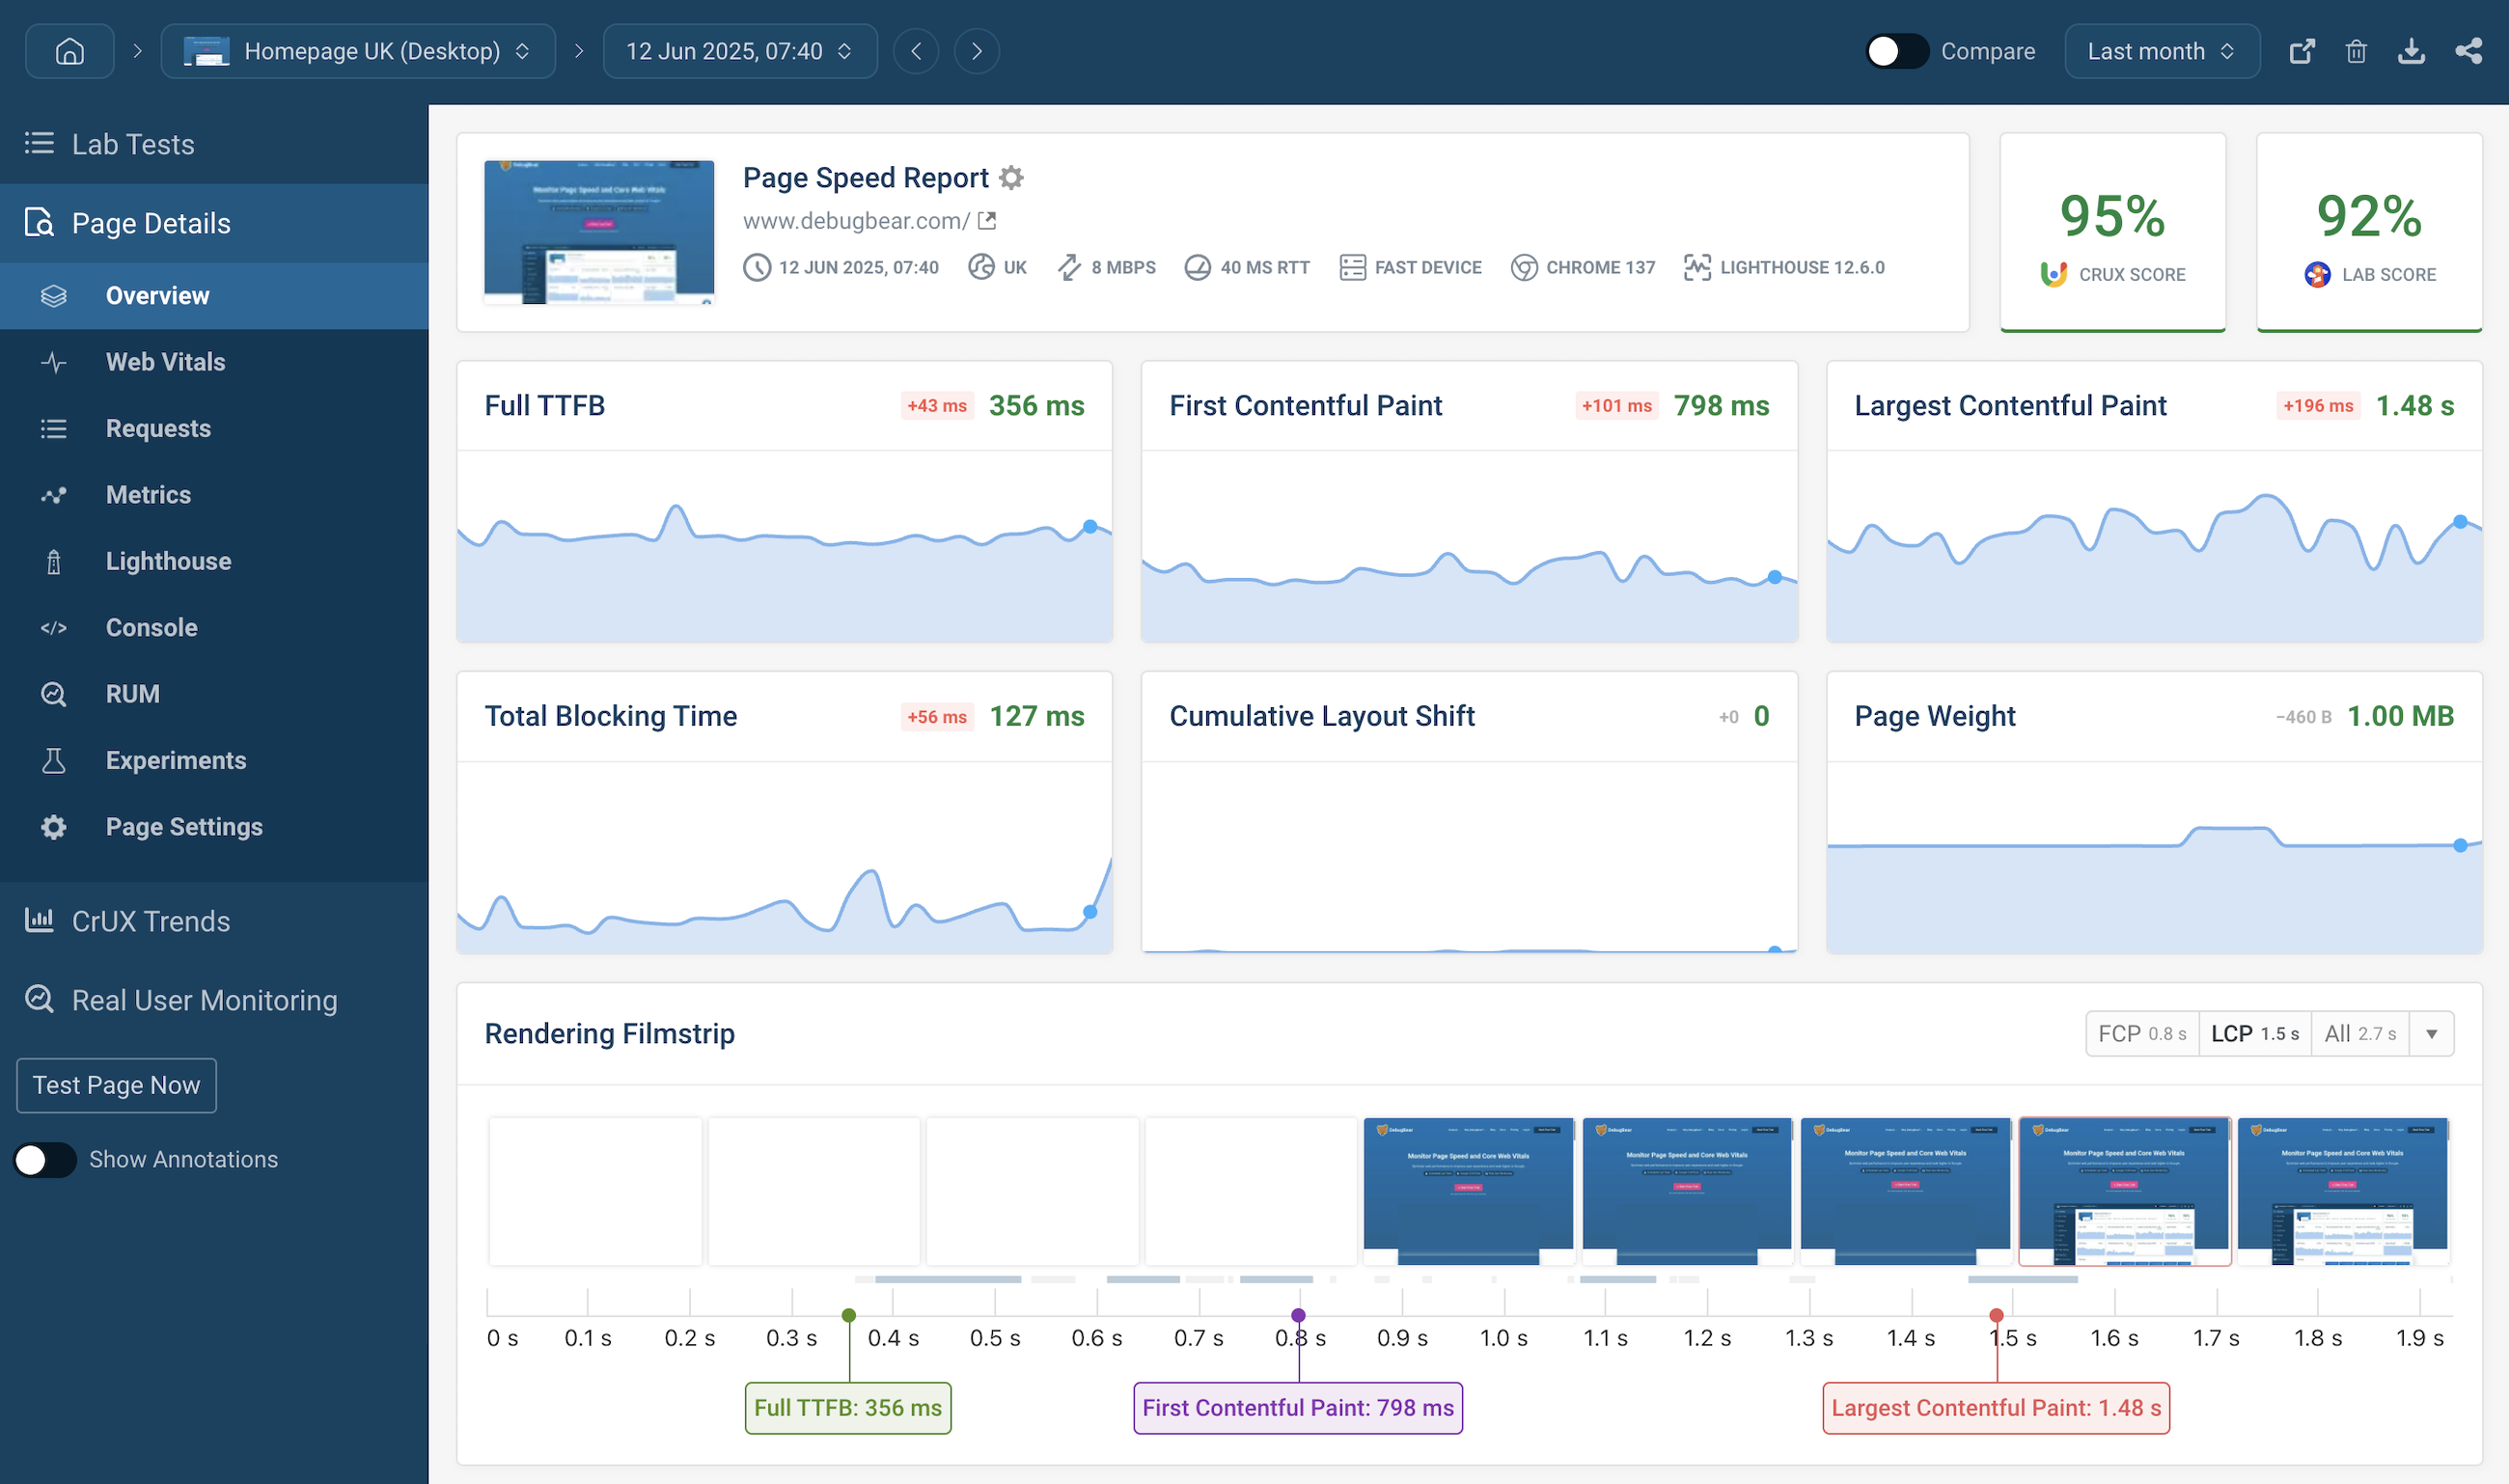
Application monitoring tracks how software applications perform in real time.
It typically measures:
- Response time
- Error rate
- Throughput
- Request latency
- Dependency performance (database, external APIs)
APM helps identify bottlenecks in backend services, slow APIs, and performance degradation.

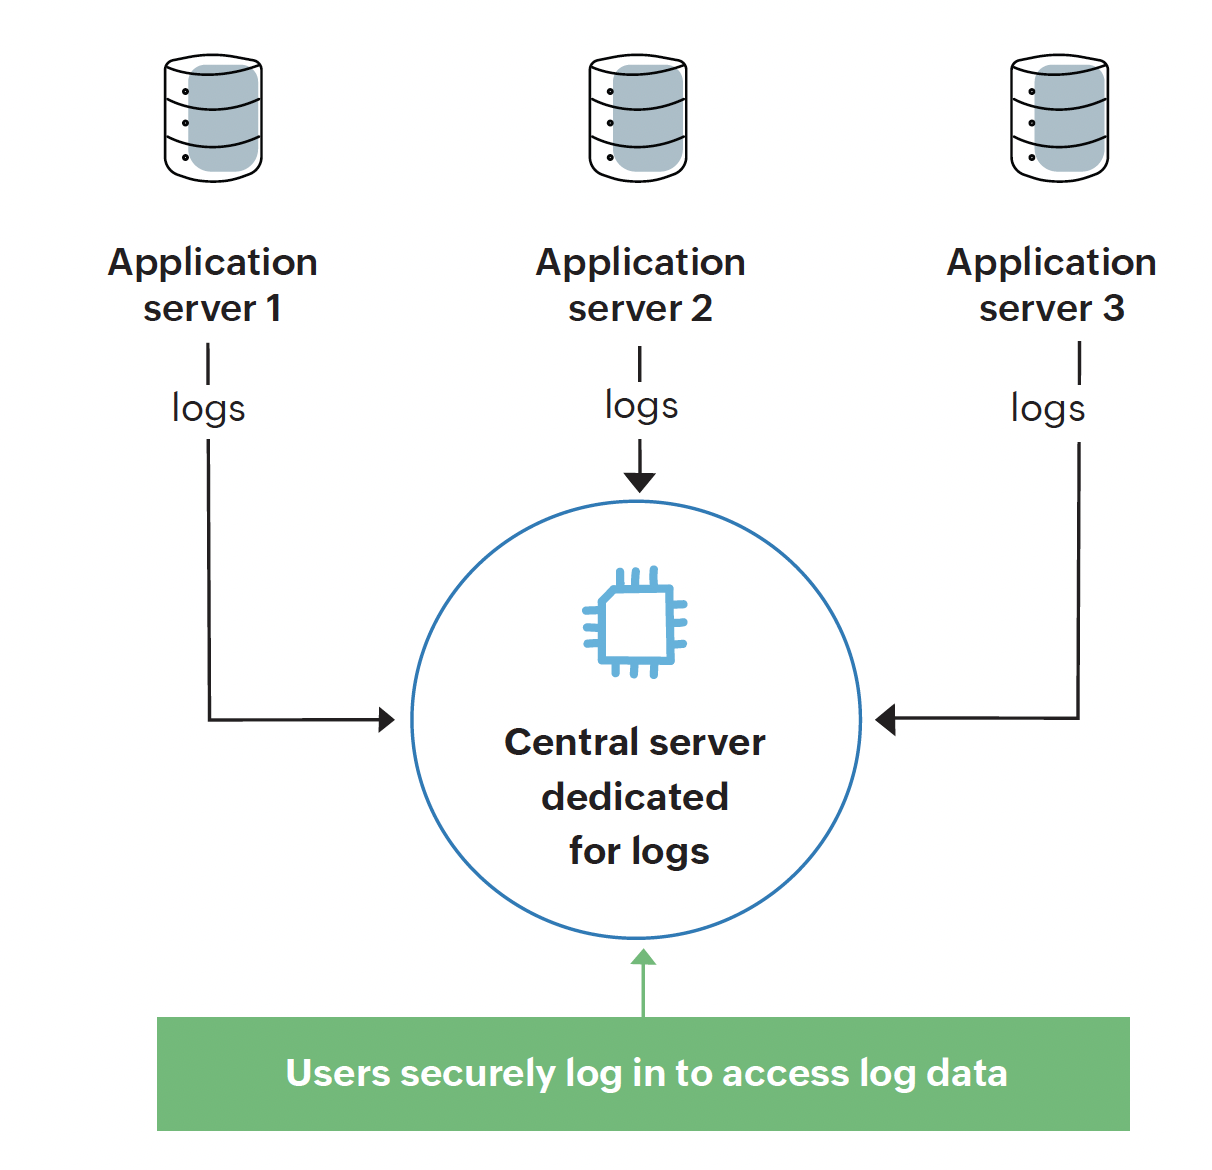

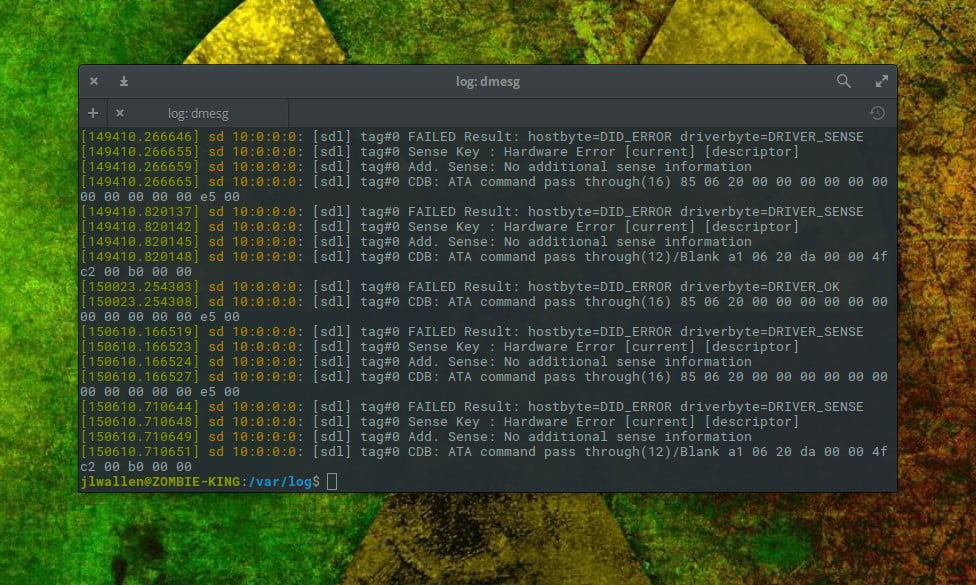
Log monitoring involves collecting and analyzing logs generated by applications and systems.
It helps in:
- Debugging application failures
- Identifying security threats
- Investigating incidents
- Tracking system behavior over time
Centralized logging systems make it easier to search and analyze logs across distributed systems.
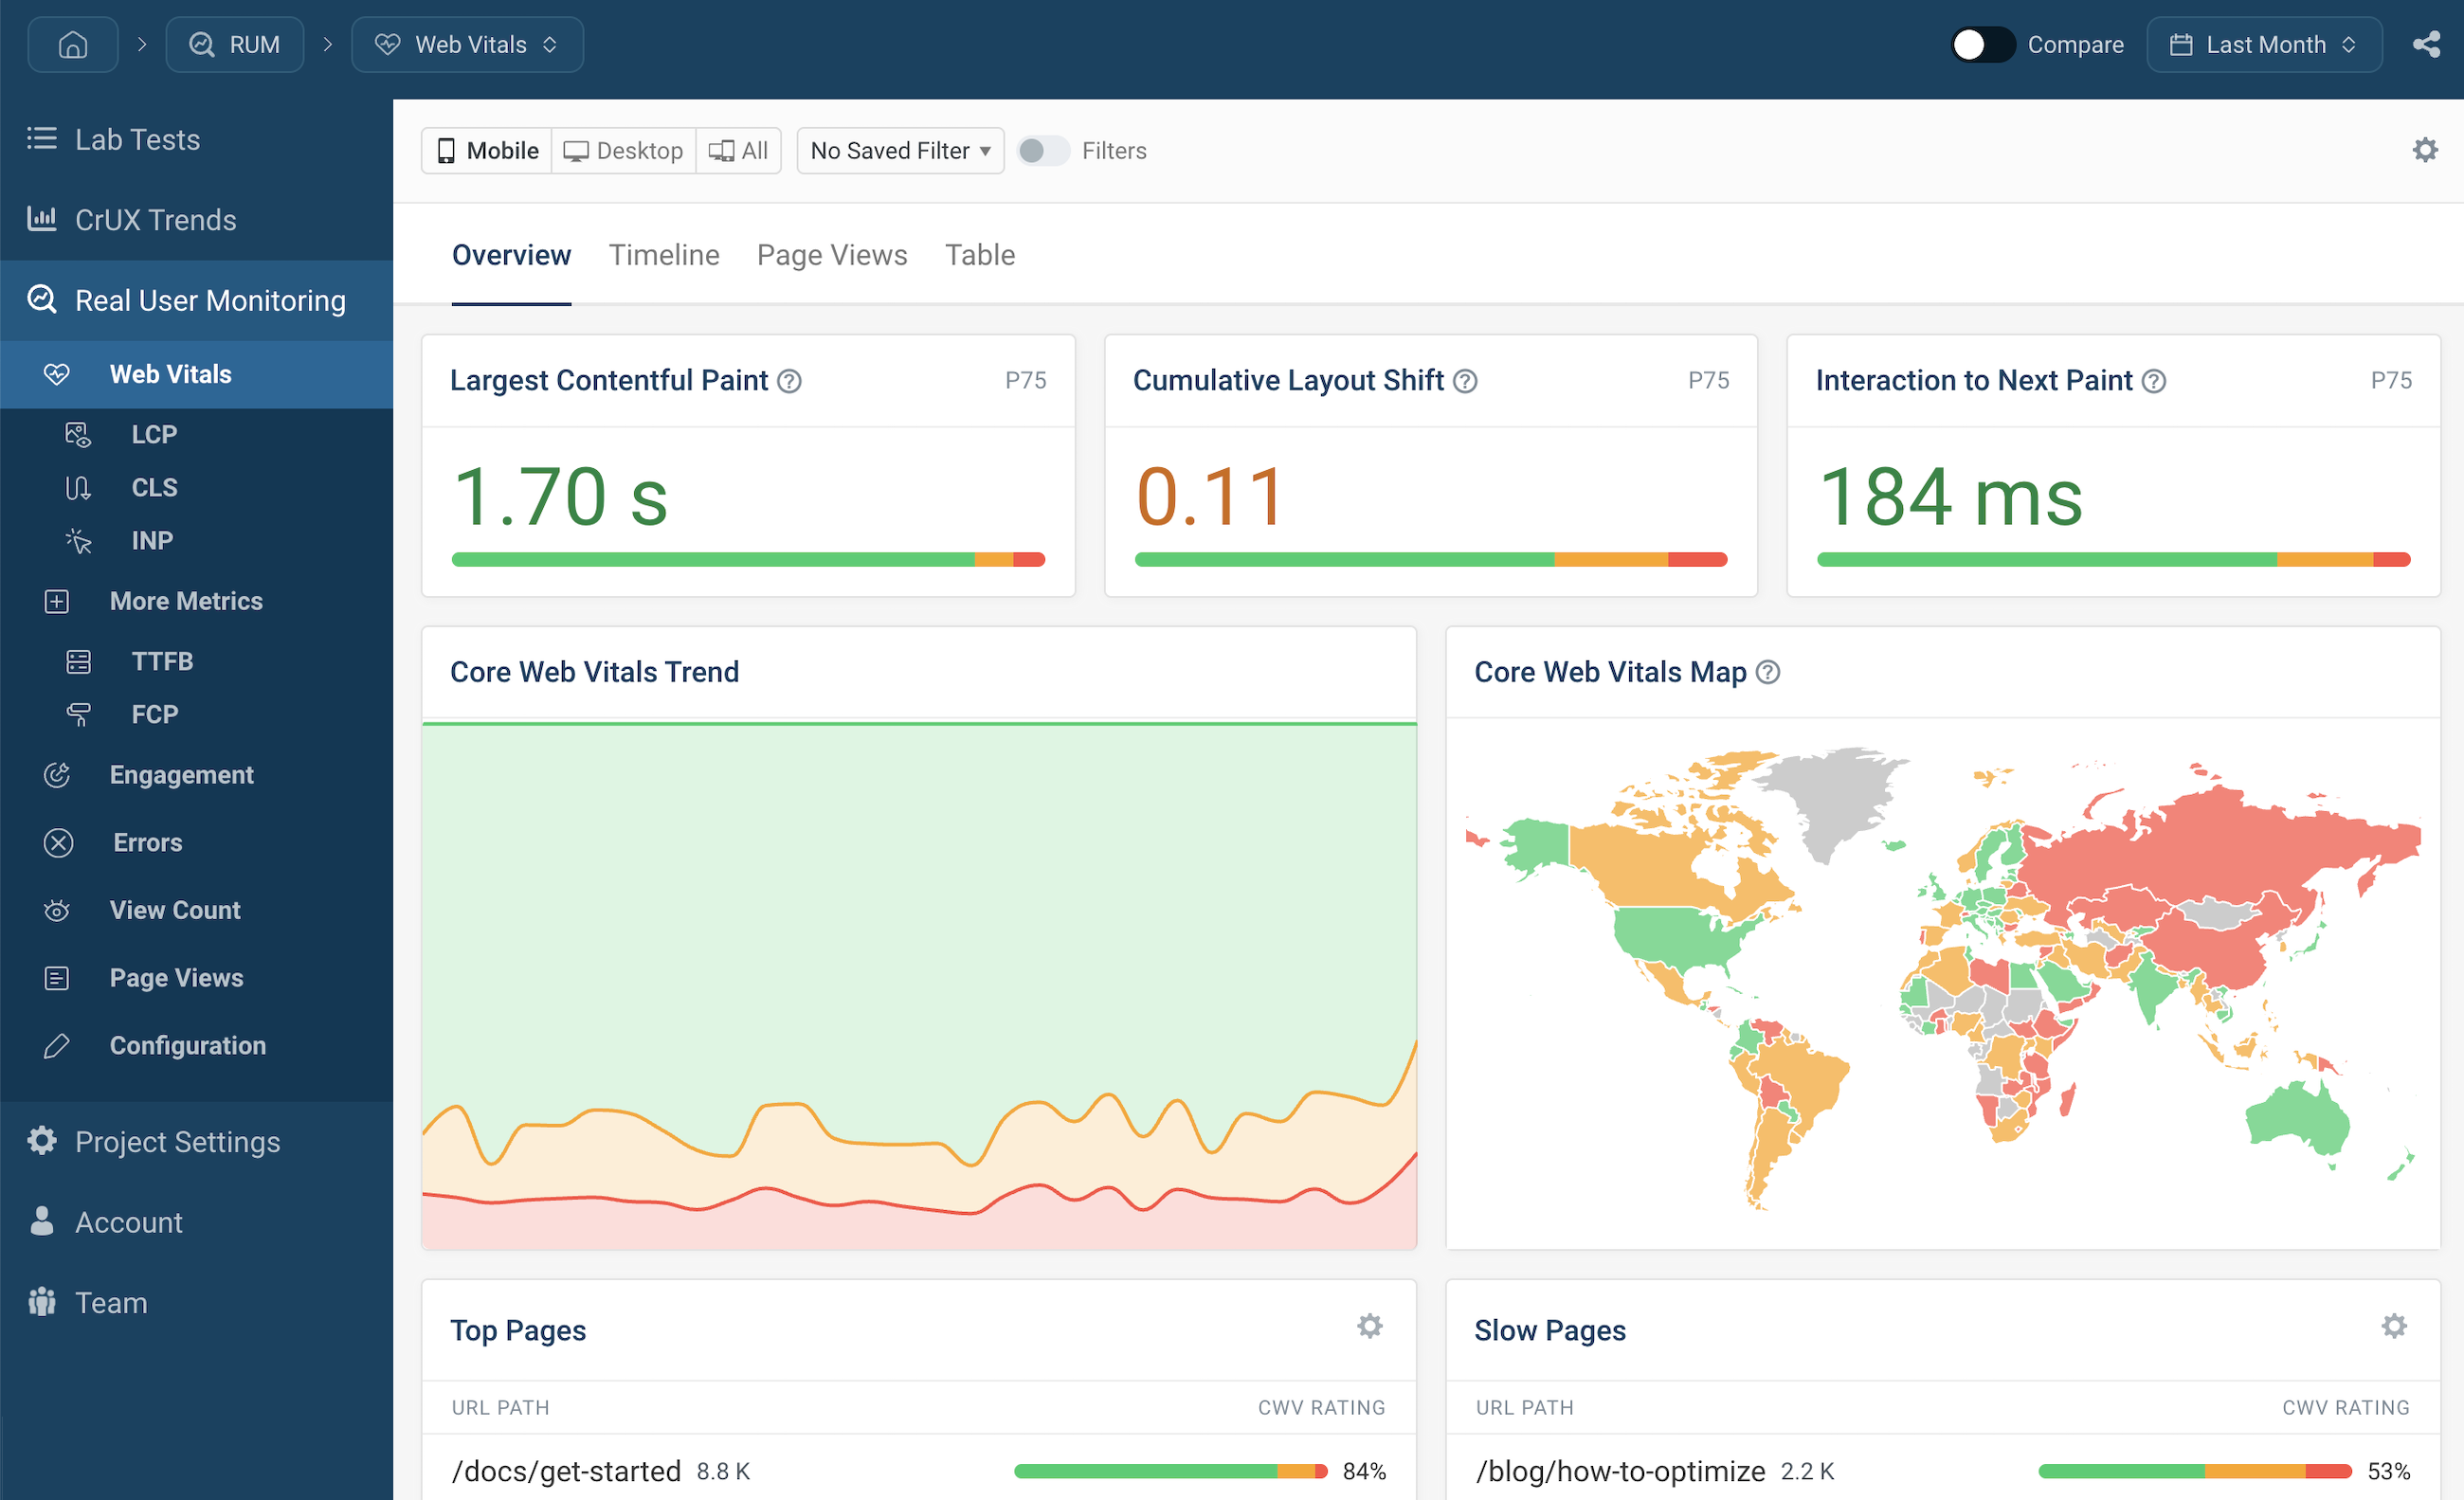

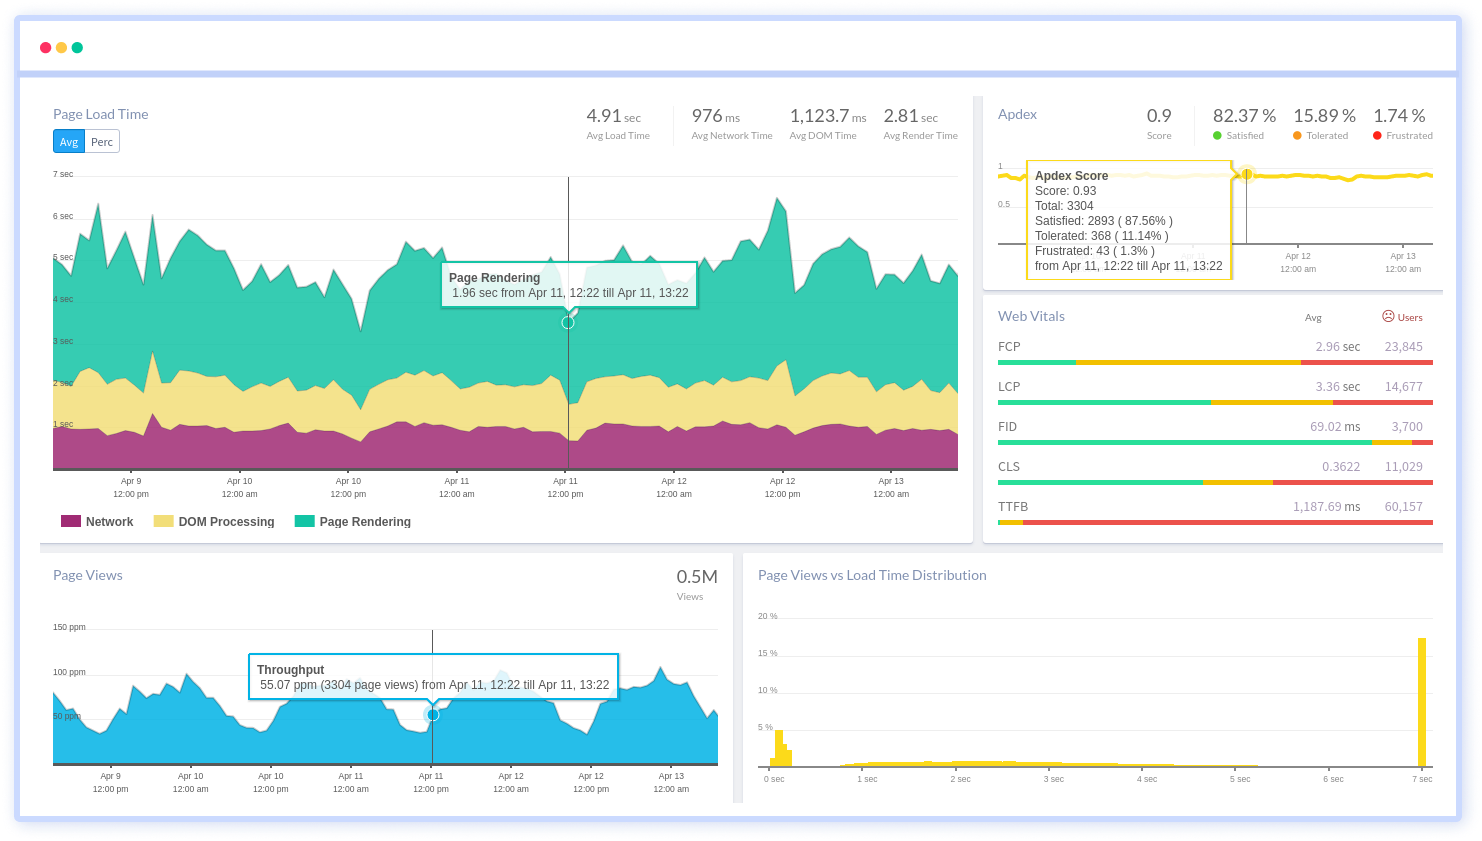
Real User Monitoring tracks the actual experience of users interacting with an application.
It measures:
- Page load time
- Frontend performance
- User session data
- Geographic performance distribution
RUM helps improve user experience and identify client-side performance issues.
- Prometheus – Open-source monitoring system based on time-series data.
- Grafana – Visualization and dashboarding tool often used with Prometheus.
- Elasticsearch – Stores and indexes logs.
- Logstash – Collects and processes logs.
- Kibana – Visualizes log data.
Together, these tools form the ELK stack.
- Amazon CloudWatch – Monitoring for AWS resources.
- Google Cloud Monitoring – Monitoring solution for GCP.
- Azure Monitor – Monitoring for Azure resources.
A common monitoring architecture includes:
- Application and infrastructure components generating metrics and logs
- Monitoring agents collecting data
- A central monitoring server (e.g., Prometheus)
- Visualization dashboards (e.g., Grafana)
- Alerting system (email, Slack, PagerDuty)
Basic flow:
Application → Metrics/Logs → Collector/Agent → Monitoring Server → Dashboard & Alerts
Monitoring is incomplete without alerting.
Alerts should be:
- Based on meaningful thresholds
- Actionable and clear
- Prioritized (critical, warning, informational)
- Integrated with communication tools
Effective alerting prevents alert fatigue and ensures rapid response.
- CPU utilization
- Memory usage
- Disk I/O
- Network latency
- Request rate
- Error percentage
- Response time
- Service availability
- Active users
- Transactions per minute
- Conversion rate
- Monitor both infrastructure and applications
- Define clear SLIs and SLOs
- Avoid excessive alerting
- Use dashboards for real-time visibility
- Implement centralized logging
- Regularly review and improve monitoring strategy
Monitoring is a core component of DevOps. It ensures system reliability, improves performance, and supports faster incident resolution. A well-designed monitoring strategy provides complete visibility into infrastructure, applications, and user experience.
It enables organizations to move from reactive troubleshooting to proactive system management.