-
|
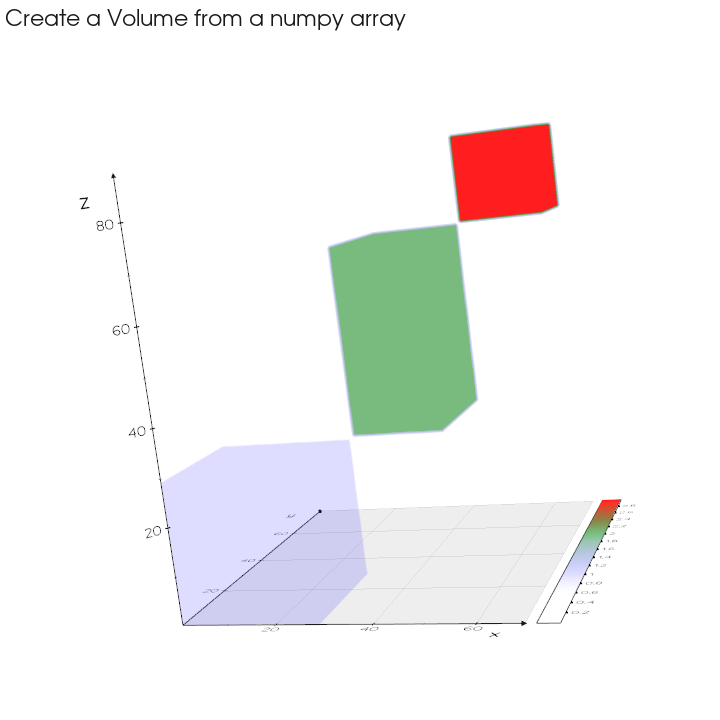
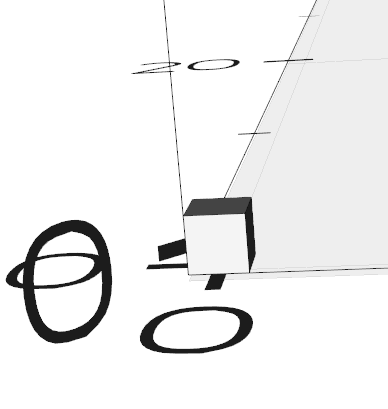
this example code can show this: I add data_matrix[1, 1, 40] = 3and then show([vol, lego], N=2, axes=1).close()I get this: point if I use how to show a single Volume Pixel by vol.legosurface? thanks! |
Beta Was this translation helpful? Give feedback.
Replies: 2 comments 5 replies
-
|
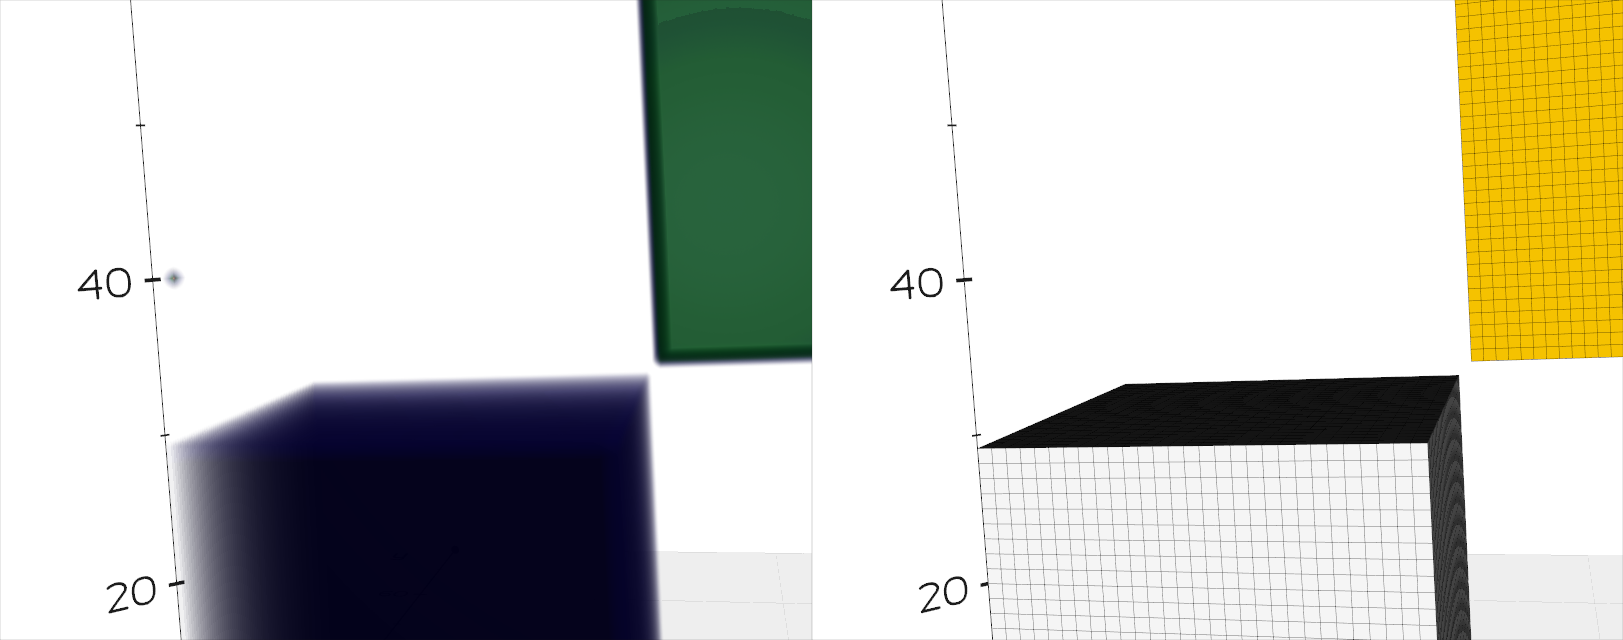
Hi, this is a bit tricky but the value from the numpy array are not associated to the voxel center but to the vertices. from vedo import *
data_matrix = np.zeros([70, 80, 90], dtype=float)
data_matrix[0:30, 0:30, 0:30] = 1.
data_matrix[30:50, 30:60, 30:70] = 2.
data_matrix[50:70, 60:80, 70:90] = 3.
data_matrix[1, 1, 40] = 3.
vol = Volume(data_matrix, c=['white','b','g','r'], mode=1)
print(vol.pointdata.keys())
print(vol.celldata.keys())
pts = Points([[0,0,0],[30,30,30], [50,60,70], [50,60,70]]).ps(10)
lego = vol.legosurface(1.5,3.5, invert=0, boundary=1)
show(vol.box(), lego, pts, axes=1).close()
|
Beta Was this translation helpful? Give feedback.
-
|
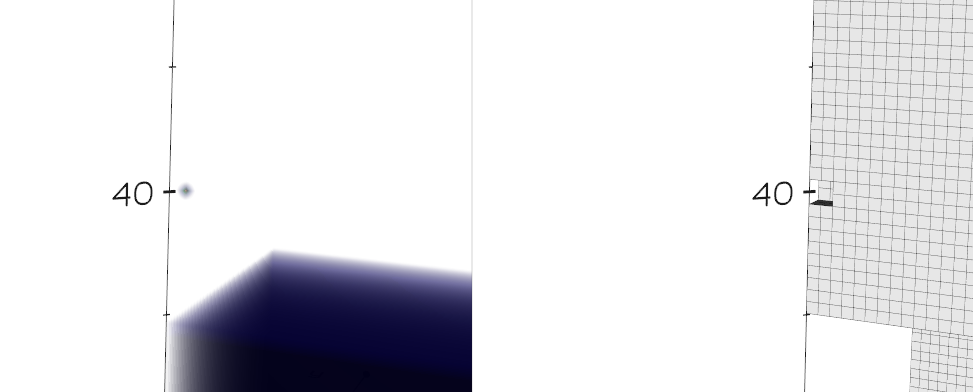
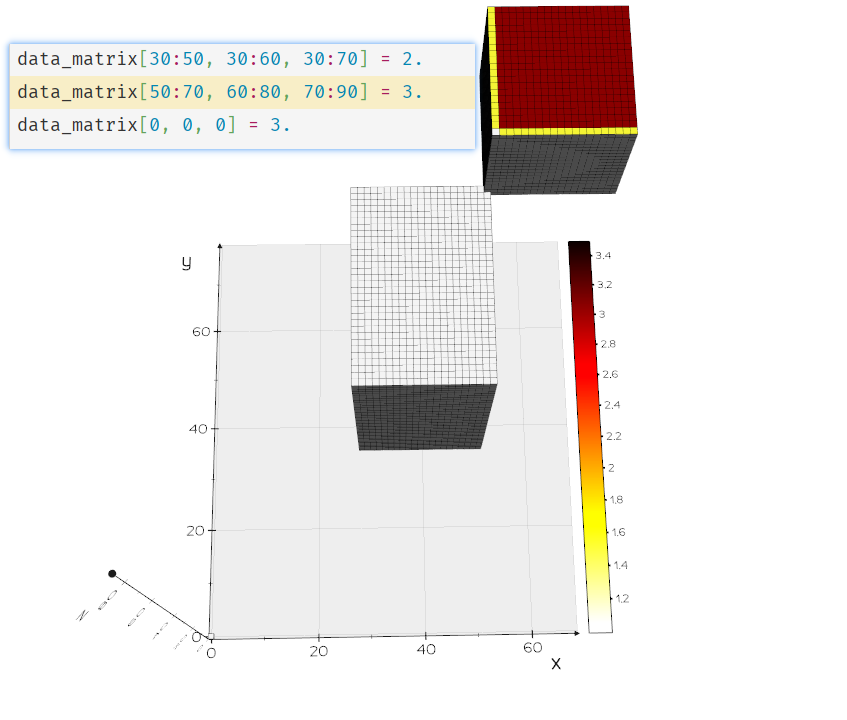
Thanks for your reply! In your demo, data_matrix[0, 0, 0] = 3
vol = Volume(data_matrix, mode=1, origin=[-0.5, -0.5, -0.5])to show a single cube like this: But I observed that the color of legosurface is error when I add Actually, what I want to visualize is a 3D occupancy grid map which created from a points cloud. |
Beta Was this translation helpful? Give feedback.
-
|
Hi what about this:
|
Beta Was this translation helpful? Give feedback.
-
|
It's like what I want! Thanks! In pcloud = Volume(counts).topoints()
marker = Cube()
glyphed_pcl = Glyph(pcloud, marker, color_by_scalar=True)
    ...
    def topoints(self):
        ...
        mpts = vedo.Points(v2p.GetOutput())
        return mpts
    ...
Which method should I use to set the value of every point? |
Beta Was this translation helpful? Give feedback.
-
|
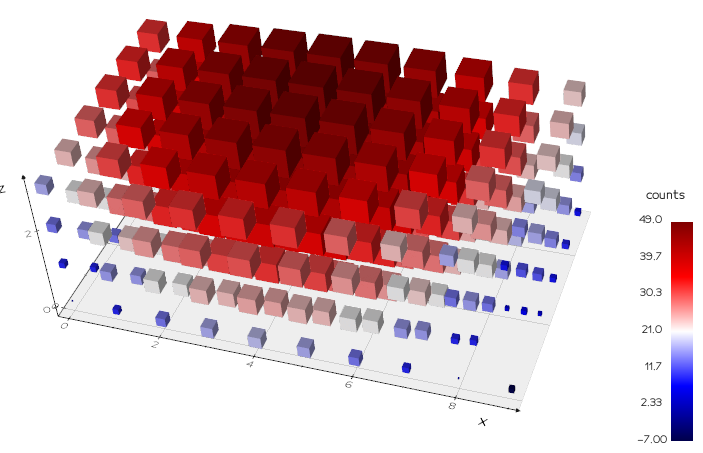
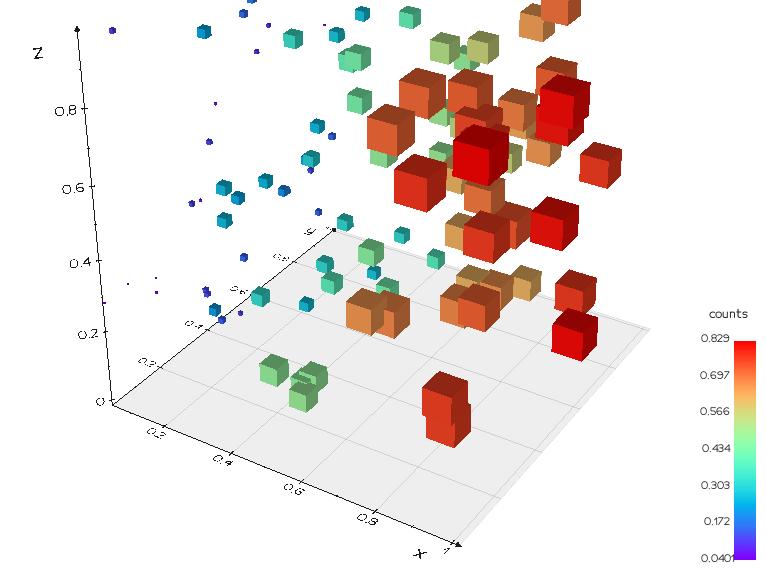
Hi, from vedo import *
pts = np.random.rand(100,3)
pcloud = Points(pts)
# add any data to each point
pcloud.pointdata["myarray1"] = np.sin(pts[:,0])
# pcloud.pointdata["myarray2"] = np.sin(pts[:,1])
marker = Cube().scale(0.1)
# pcloud.pointdata.select("myarray1")
glyph = Glyph(pcloud, marker, scale_by_scalar=True)
glyph.cmap('rainbow').add_scalarbar('counts')
show(glyph, axes=1)
|
Beta Was this translation helpful? Give feedback.
-
|
It works! Thanks! |
Beta Was this translation helpful? Give feedback.
-
I will set up one! :) Let me know if need more help. |
Beta Was this translation helpful? Give feedback.
Thanks for your reply!
In your demo,
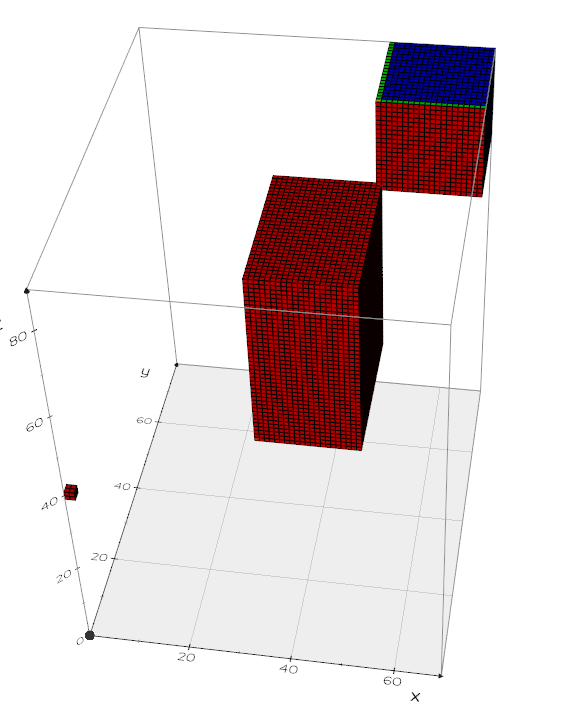
boundary=1invol.legosurfacemake the little cube visible.Enlighten by numpy array are associated to the vertices, I can use
to show a single cube like this:
But I observed that the color of legosurface is error when I add
lego.cmap('hot_r', vmin=1, vmax=3.5).add_scalarbar3d()afterlego = vol.legosurface(1.0, 3.5, boundary=1).The middle large dataset and the single cube at [0,0,0] should be yellow. What can I do to show the right color?Actually, what I want to visualize is a 3D occupancy grid map which created from a points cloud.
For example, if there is any …