Hi,
I installed a SOS plugin in NIWA with a couple of DLL's sent to me by a co-worker. I believe this is the source code repository for those DLL's, so I am reporting the issue here. In case it doesn't make sense, and this is not the right repository, I apologise and ask to please ignore it :-)
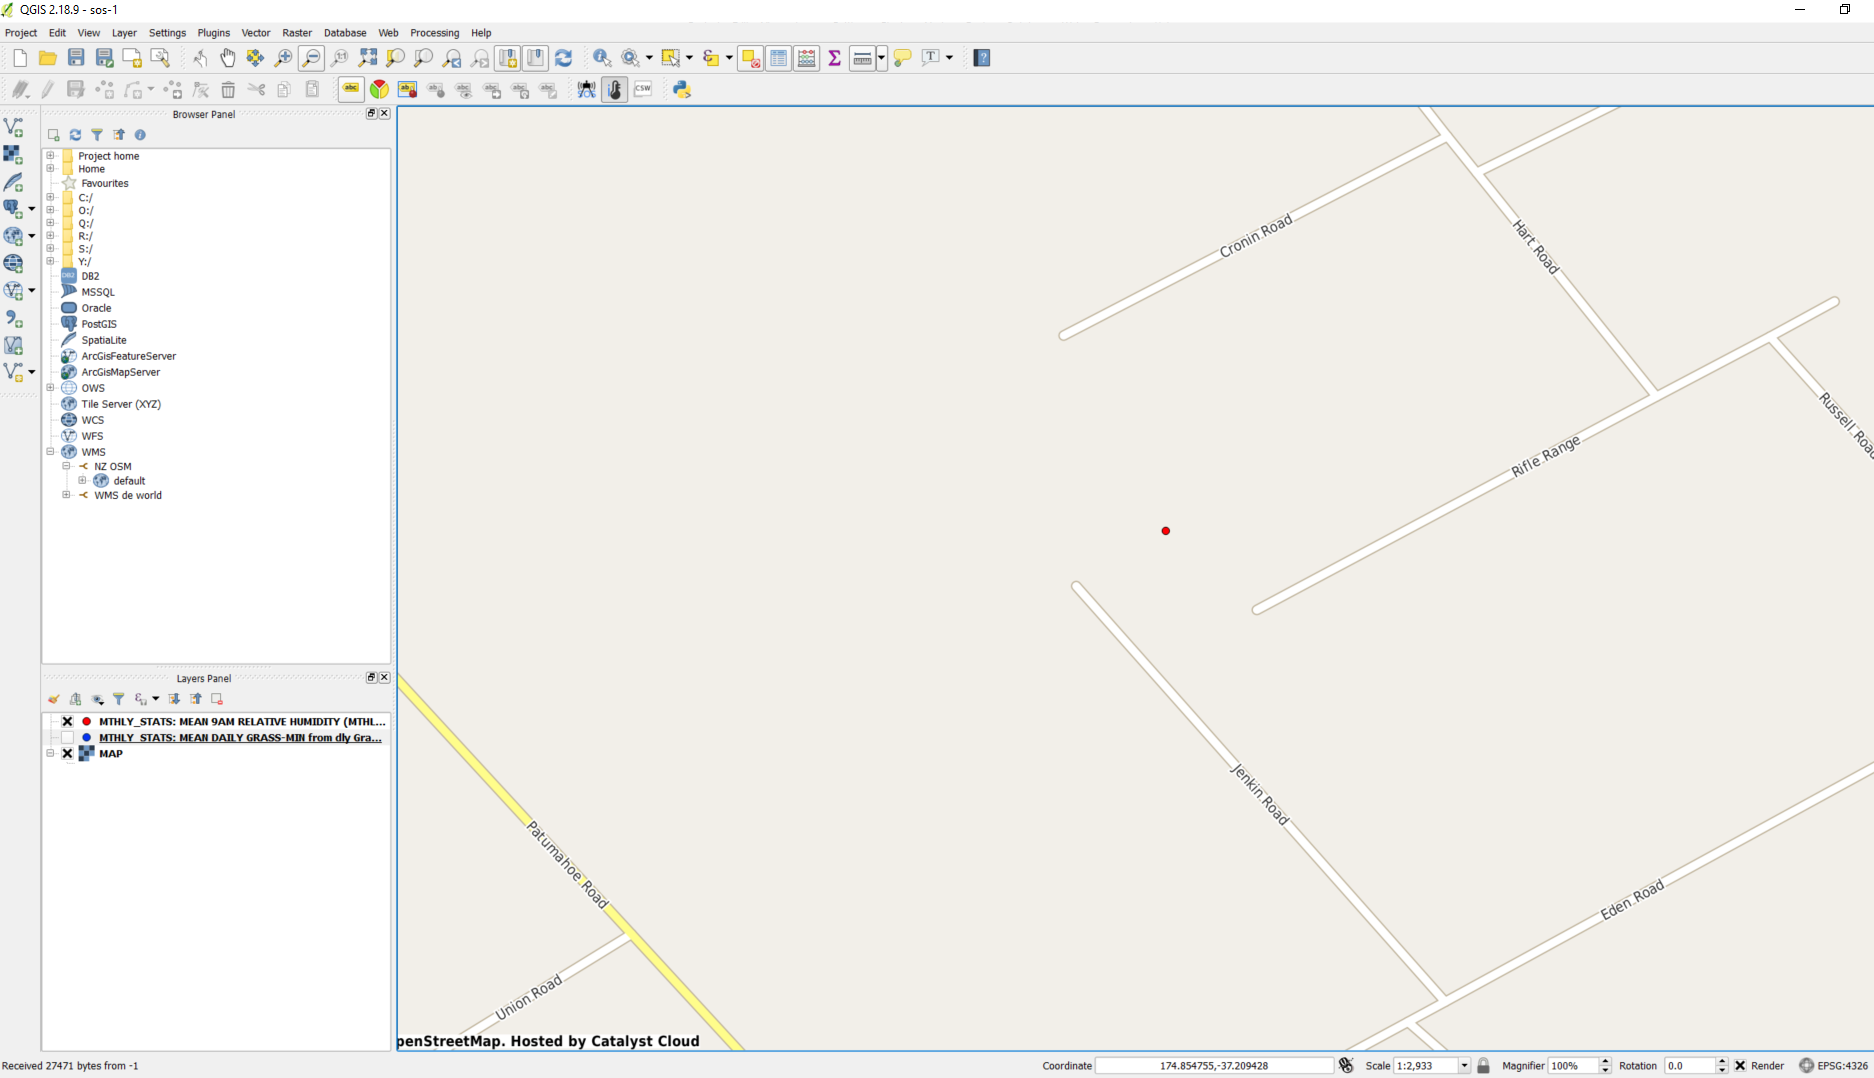
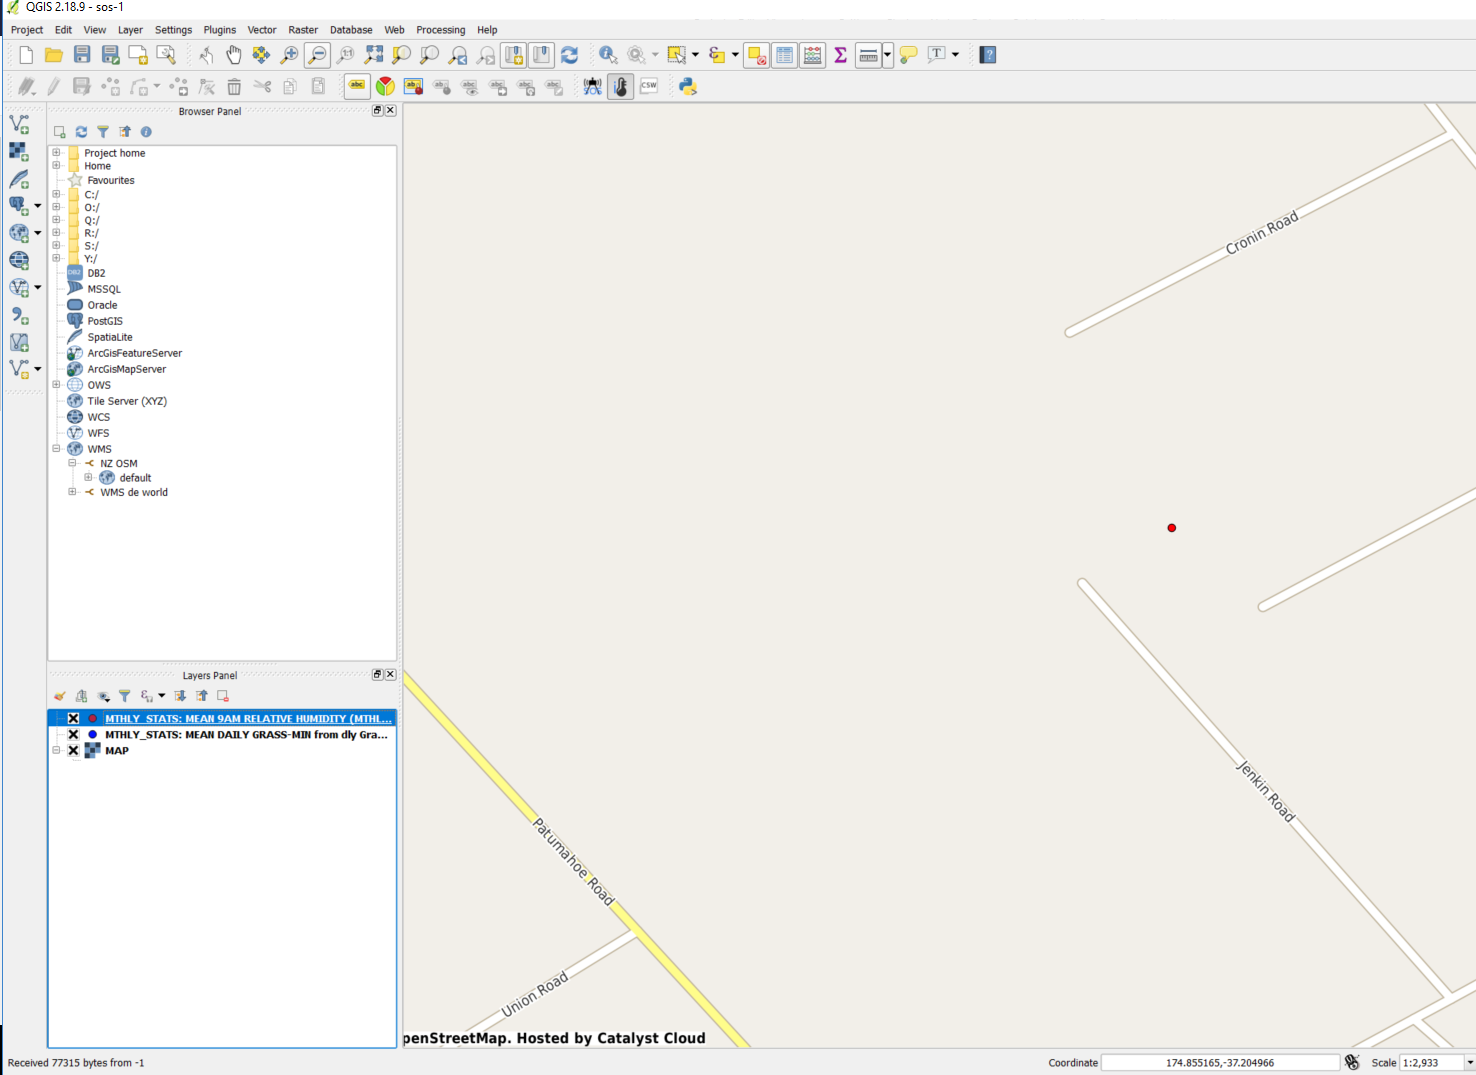
I added two observable properties to my map, on top of a OpenStreetMap WMS. I can see the icons/markers on the map just fine. The issue is when I have icons that overlap on top of each other, and try to access the Sensor Info. I think the behaviour is not consistent, but I could also be doing something wrong.
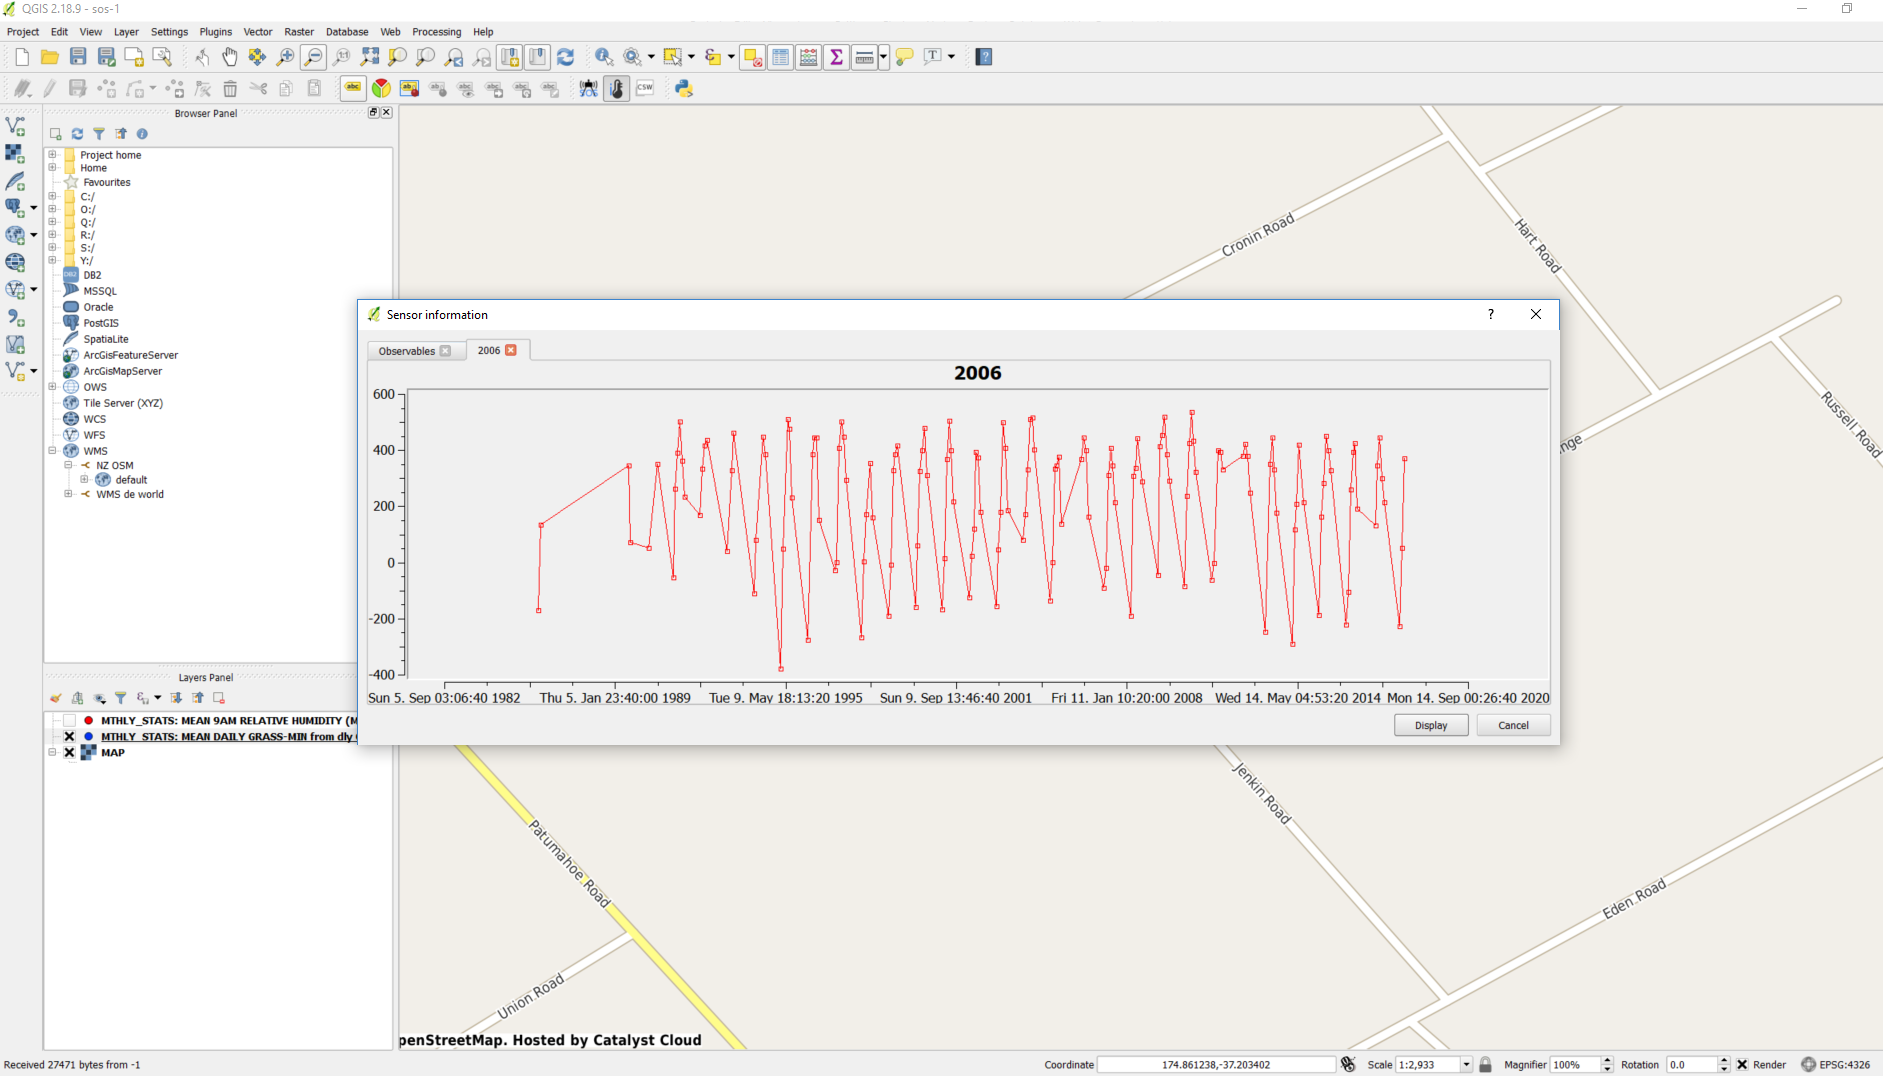
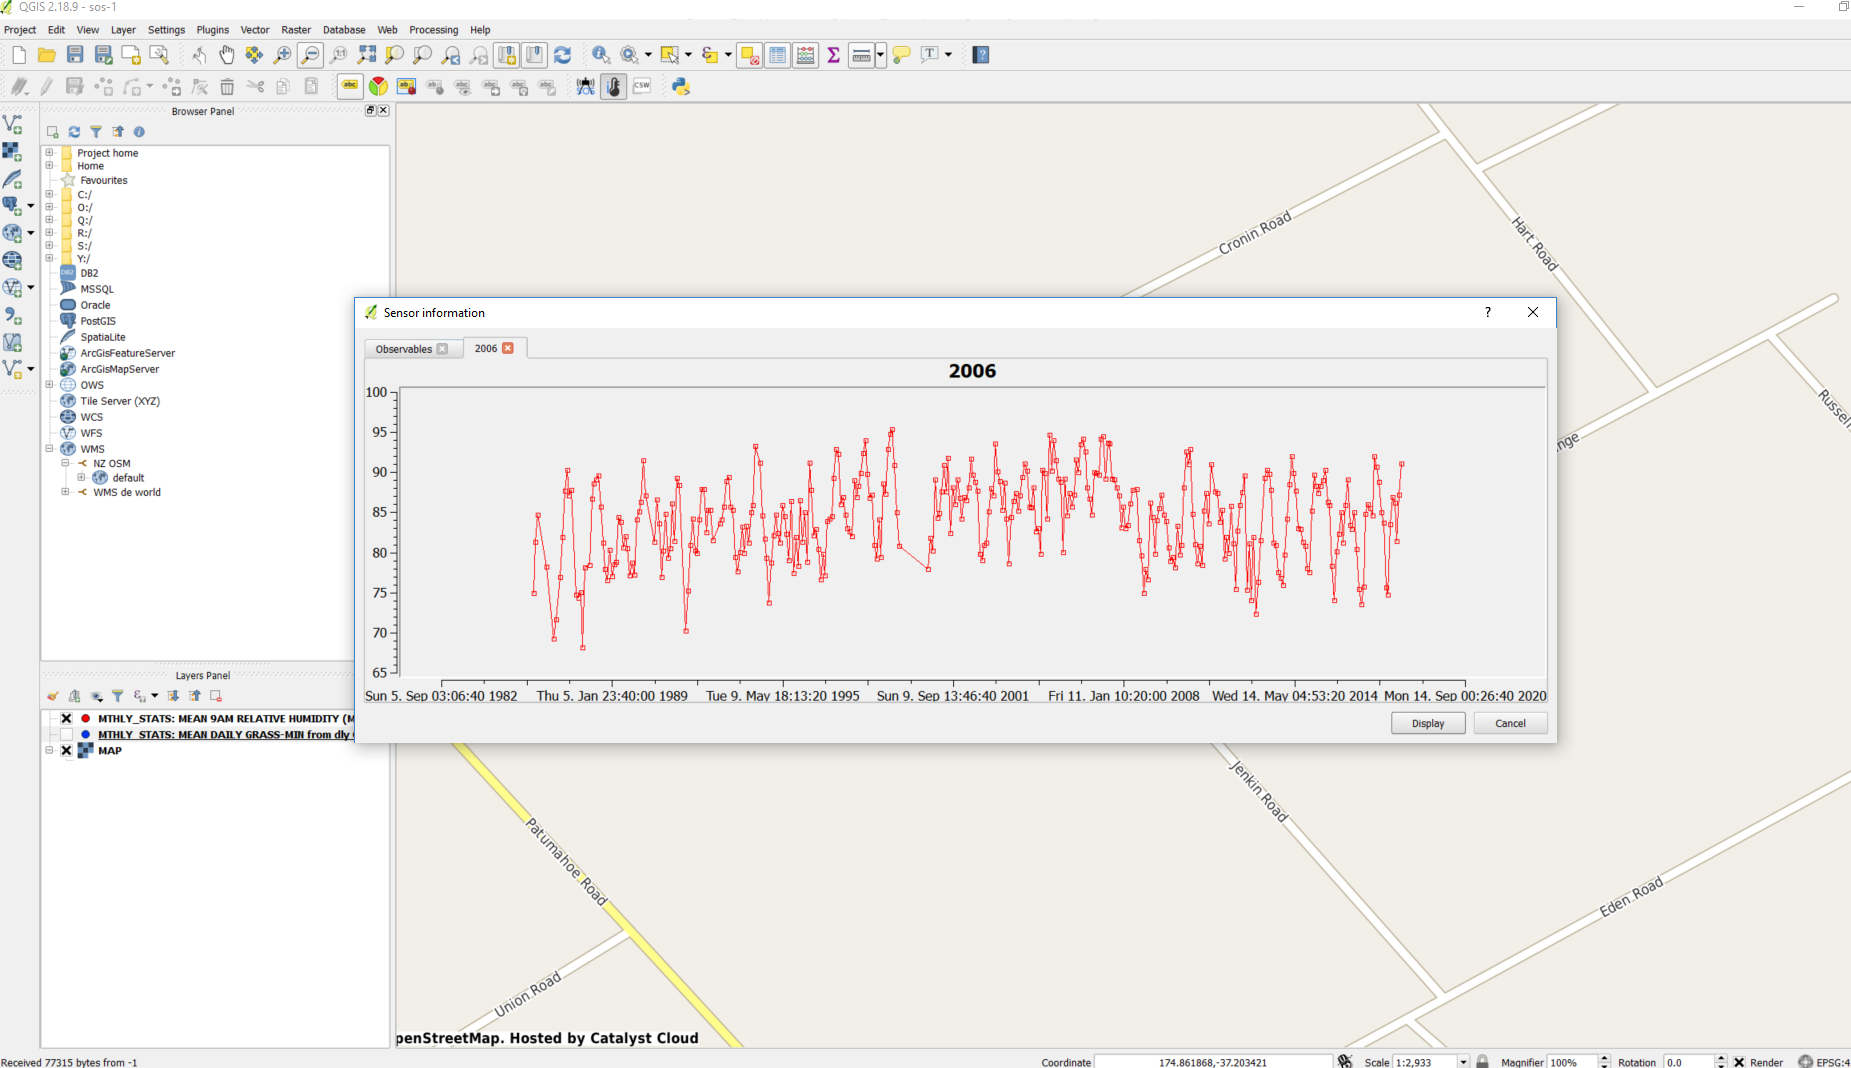
In the following screen shots I am working with two observable properties that overlap. First I hide one (Red), so that I can filter the other one (Blue) and plot. That works OK.
Then I hide the Blue one, and display only the Red. And repeat the process to plot it.
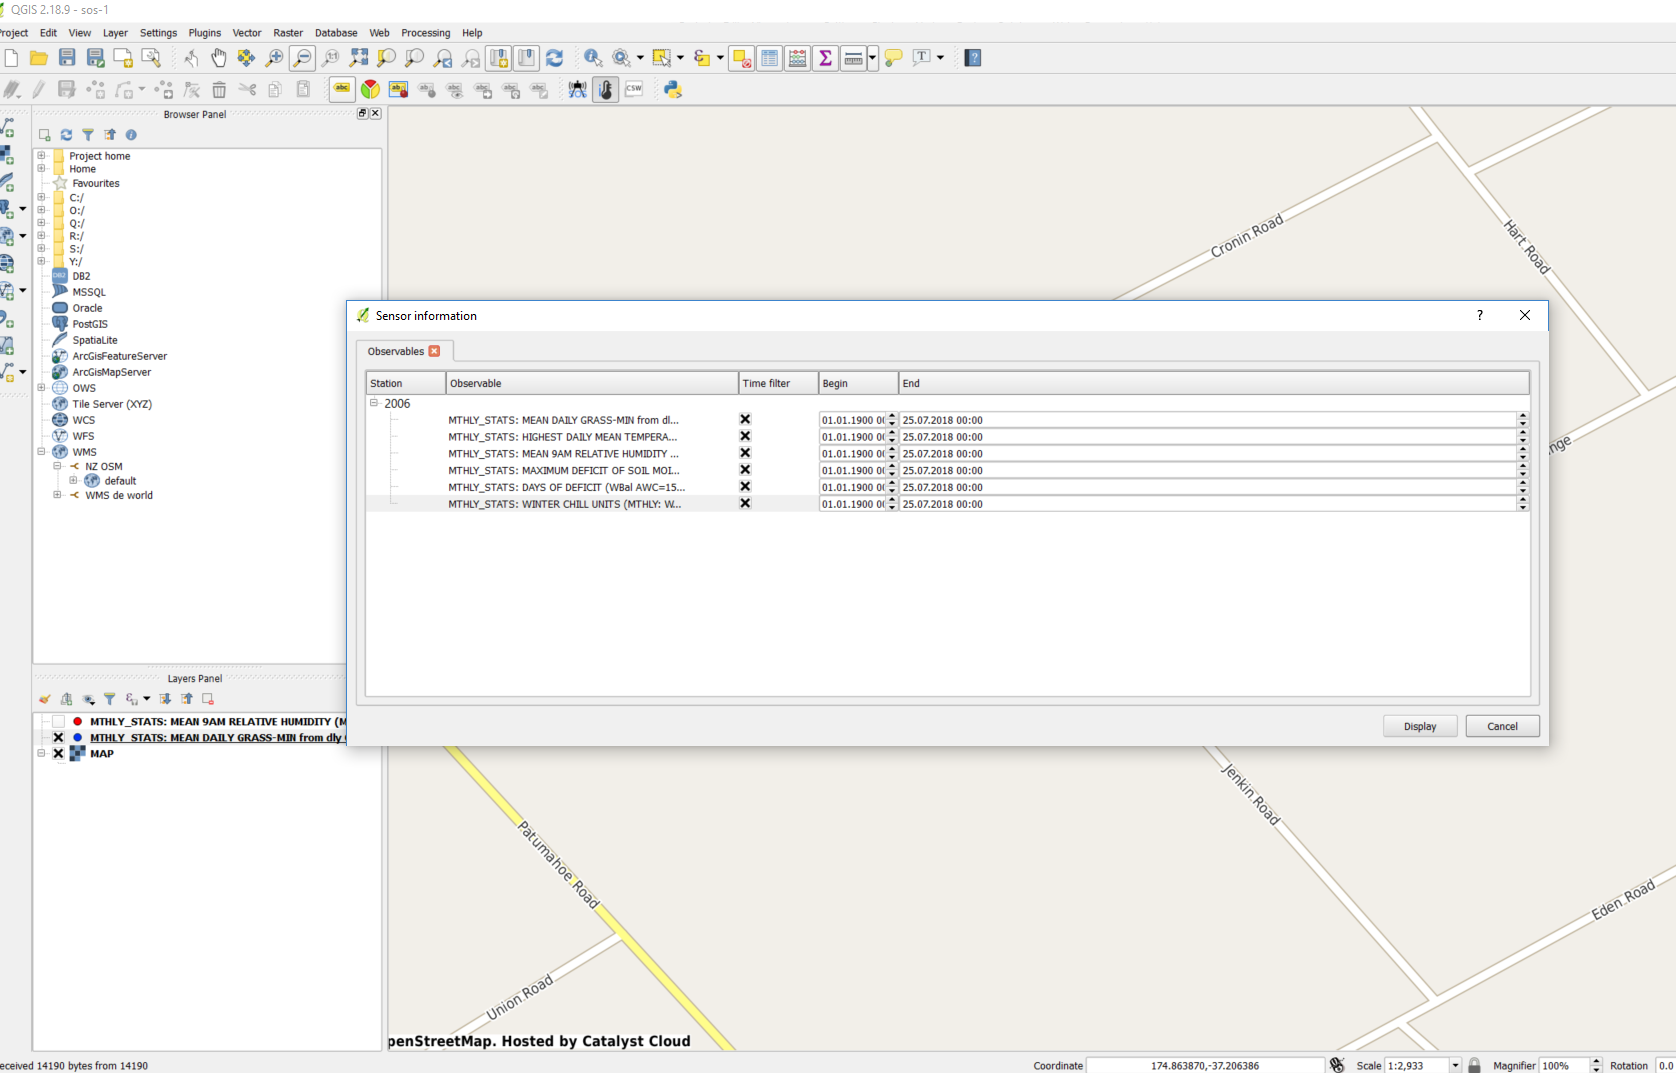
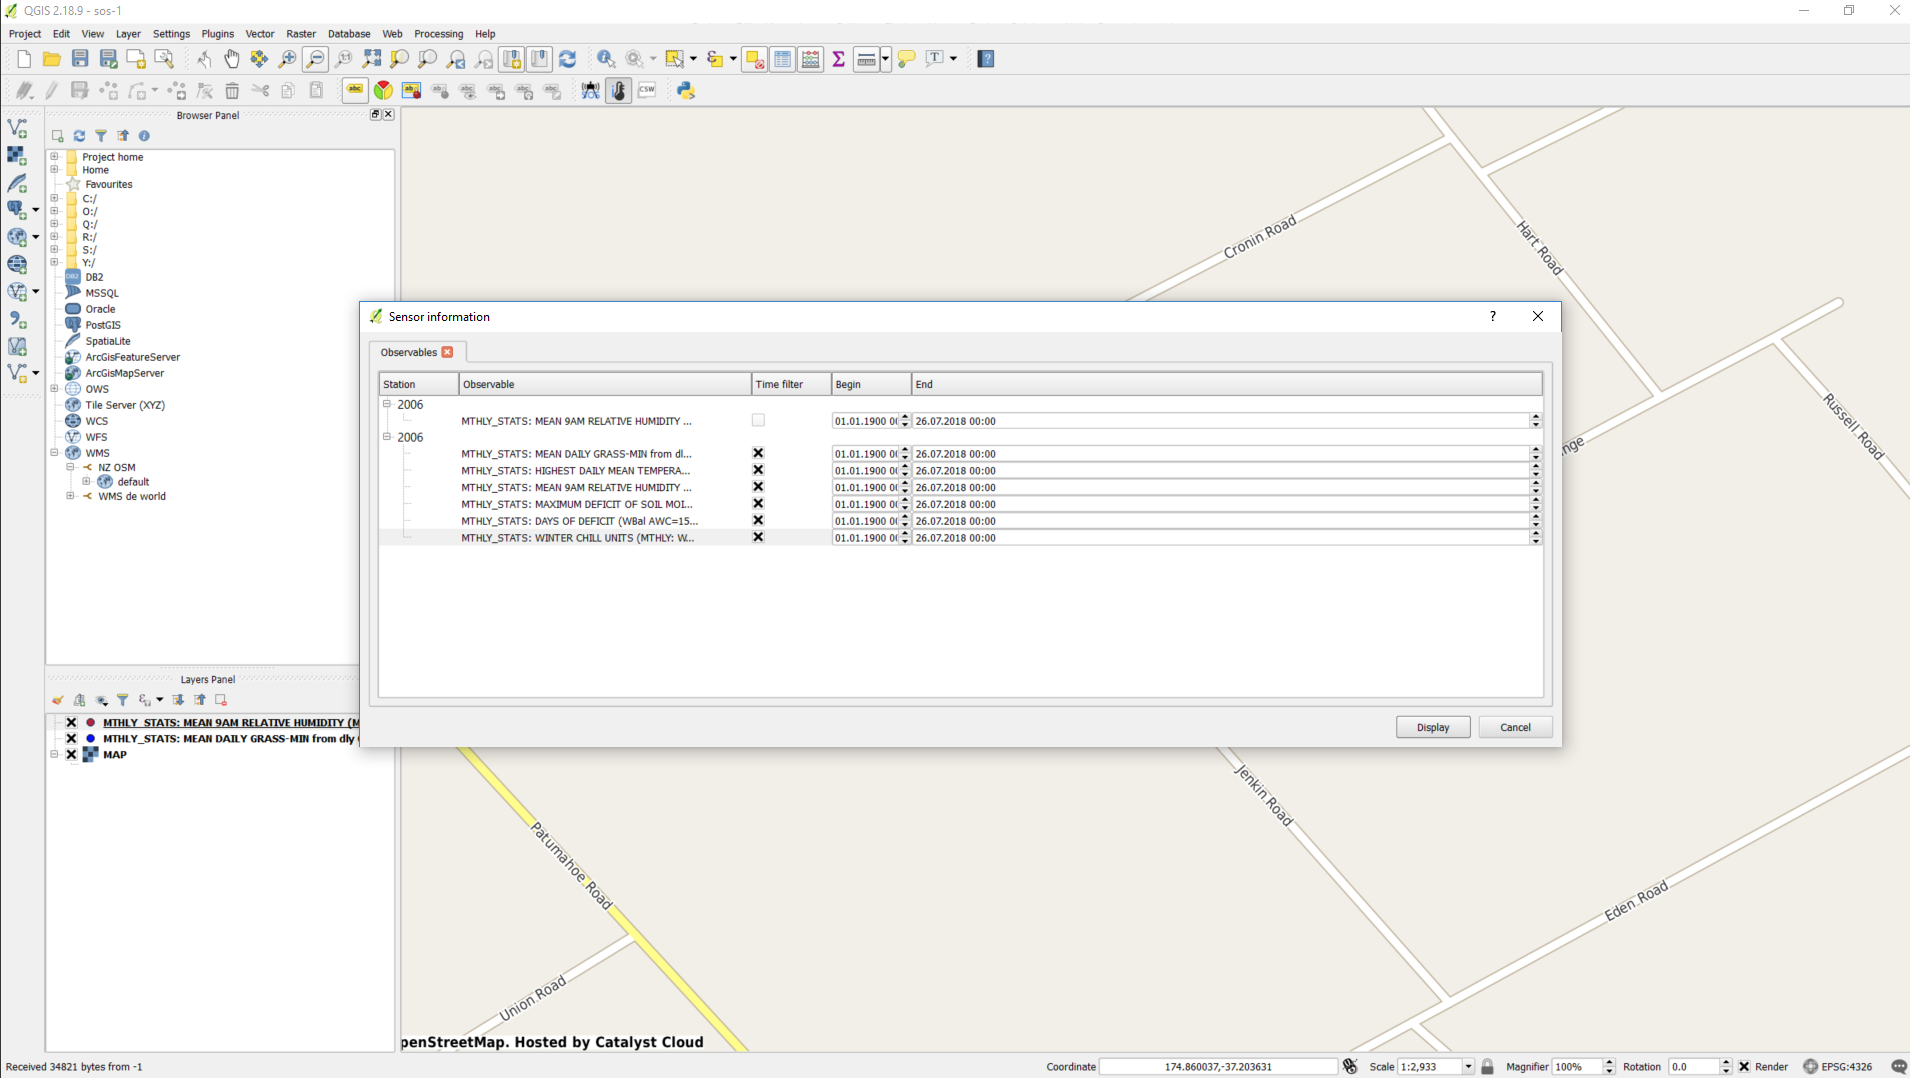
But if I do not filter the layers, and instead display both...
If I do not change the filters, and plot everything, I get the plot from the first example above.
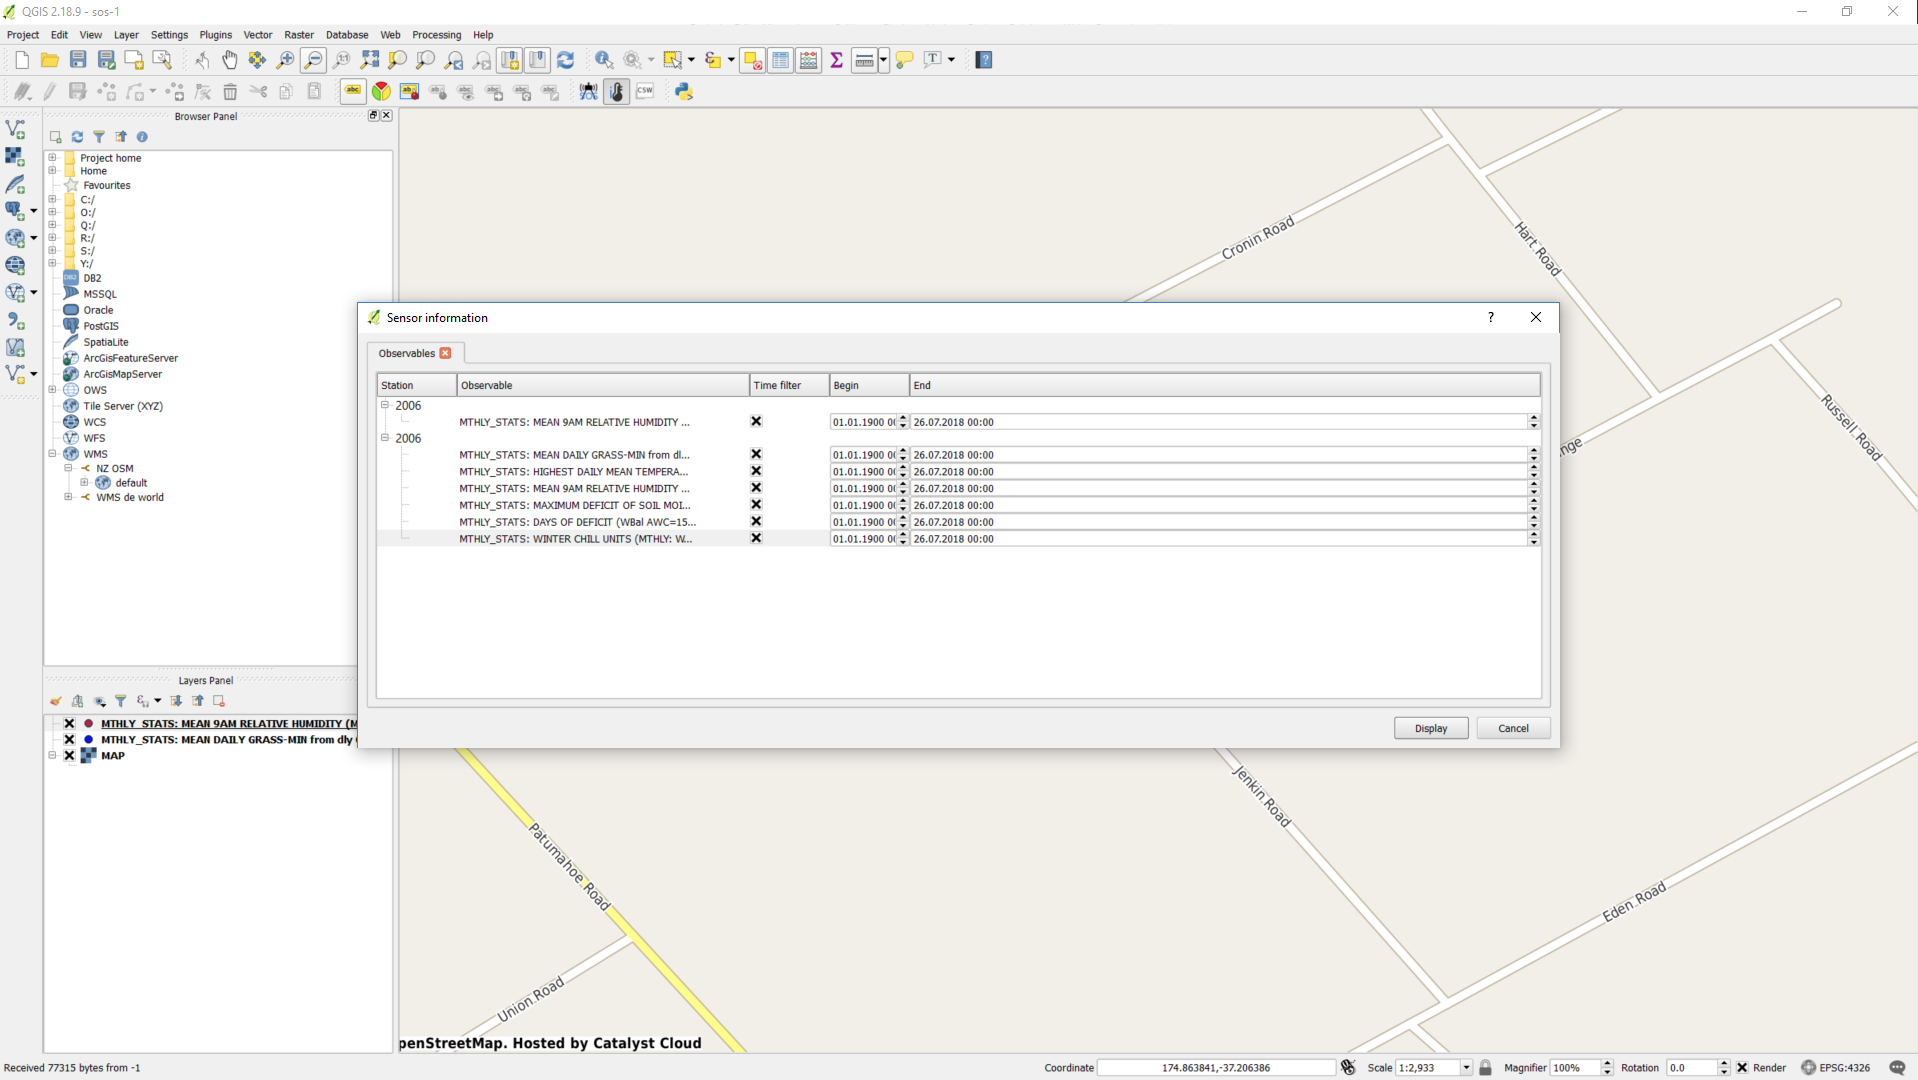
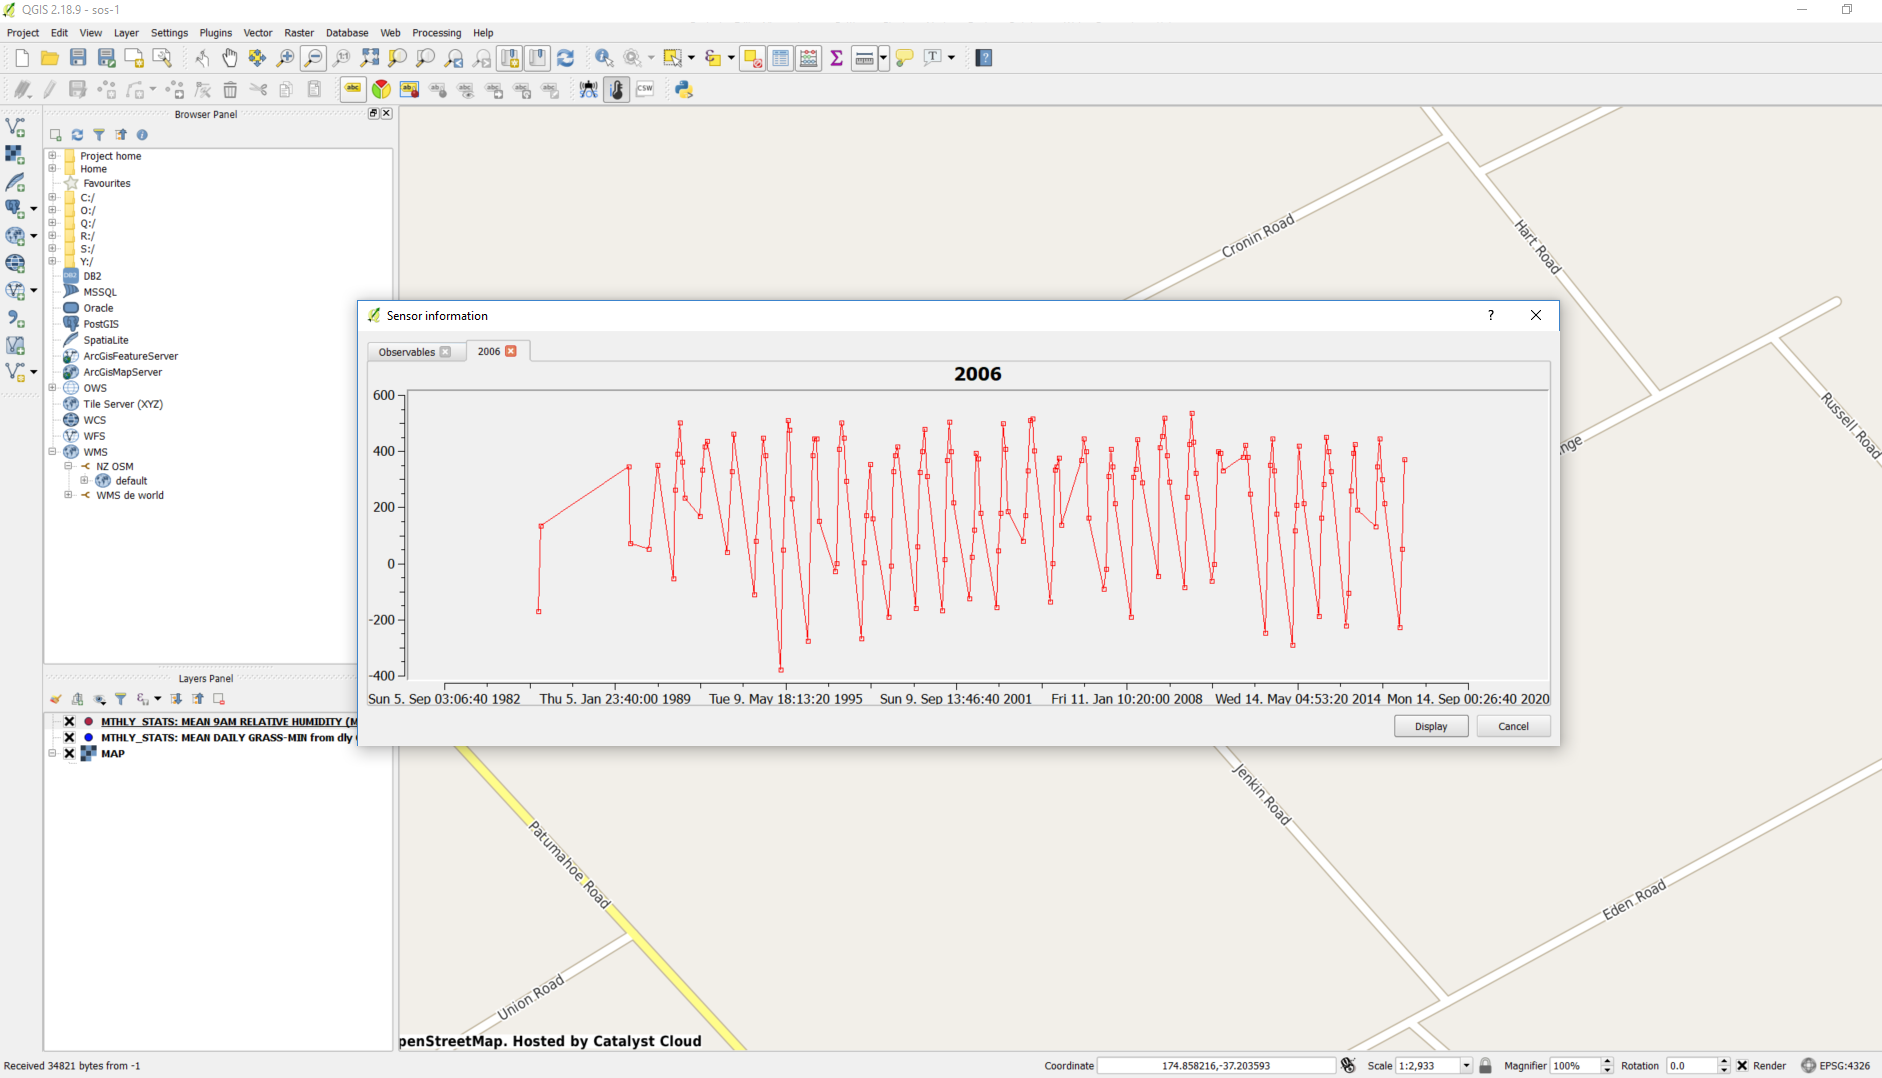
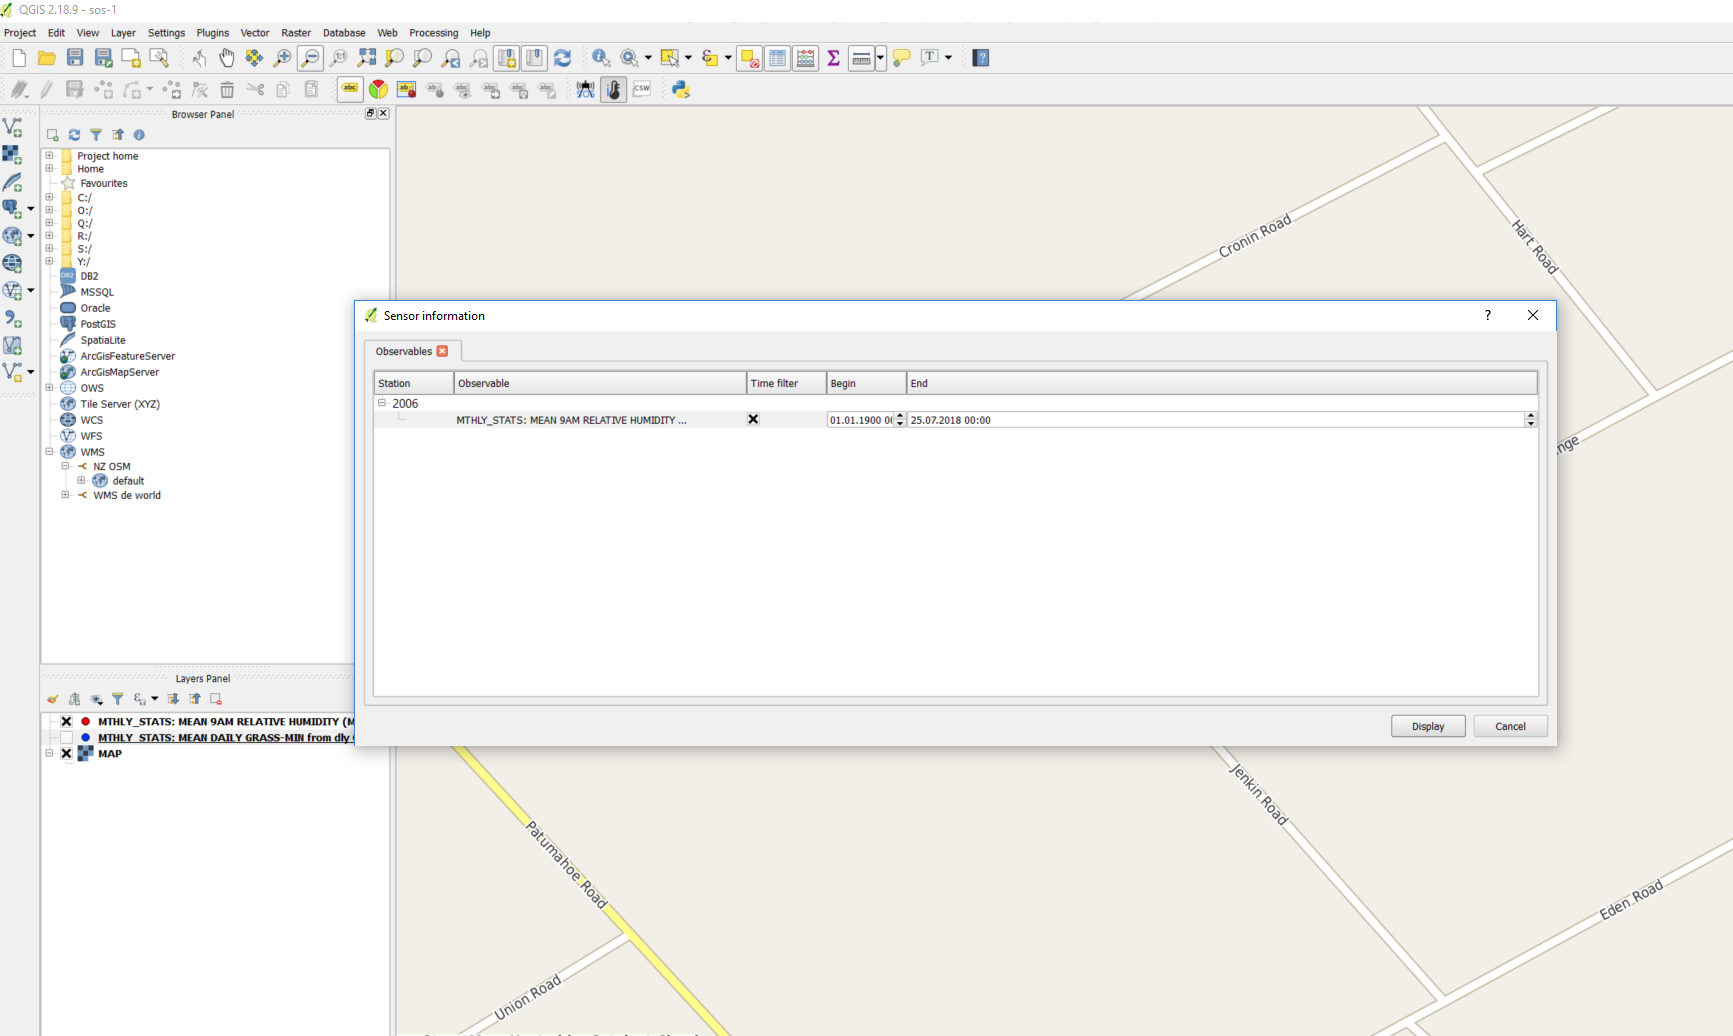
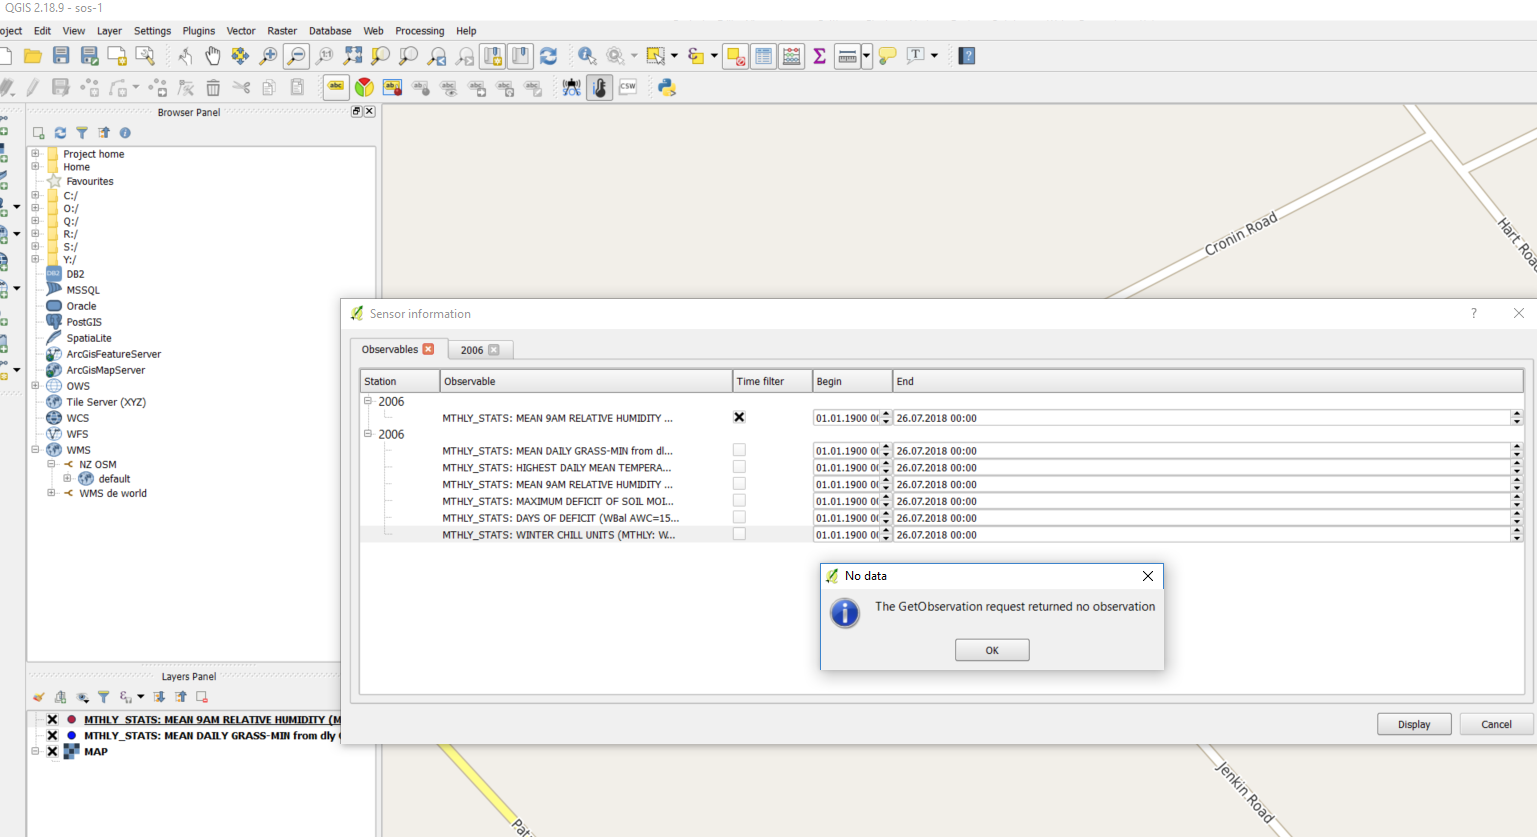
Same result if I uncheck the bottom time filters for the Blue one. On the other hand, if I check only the check box for the Red one...
I expected maybe to get the other plot... but instead I get an error message.
Maybe I am doing something wrong?
Cheers
Bruno
Hi,
I installed a SOS plugin in NIWA with a couple of DLL's sent to me by a co-worker. I believe this is the source code repository for those DLL's, so I am reporting the issue here. In case it doesn't make sense, and this is not the right repository, I apologise and ask to please ignore it :-)
I added two observable properties to my map, on top of a OpenStreetMap WMS. I can see the icons/markers on the map just fine. The issue is when I have icons that overlap on top of each other, and try to access the Sensor Info. I think the behaviour is not consistent, but I could also be doing something wrong.
In the following screen shots I am working with two observable properties that overlap. First I hide one (Red), so that I can filter the other one (Blue) and plot. That works OK.
Then I hide the Blue one, and display only the Red. And repeat the process to plot it.
But if I do not filter the layers, and instead display both...
If I do not change the filters, and plot everything, I get the plot from the first example above.
Same result if I uncheck the bottom time filters for the Blue one. On the other hand, if I check only the check box for the Red one...
I expected maybe to get the other plot... but instead I get an error message.
Maybe I am doing something wrong?
Cheers
Bruno