Exploit hierarchical structure also in vis #13
Description
This is more like "feature request" or even an open-ended discussion (if you prefer to have it on email, mine is [email protected]).
In definition of layers you use hierarchical structures. However, in visualisation you don't - so even AlexNet looks heavy VGG16 - unreadable, and I don't dare thinking about GooglLeNet or ResNet.
How about exploiting this structure not only in definitions, but also - drawings. And passing "free hyperparameters" of layers, e.g. the number of channels. See e.g.:

from Deep learning for satellite imagery via image segmentation (by my colleague).
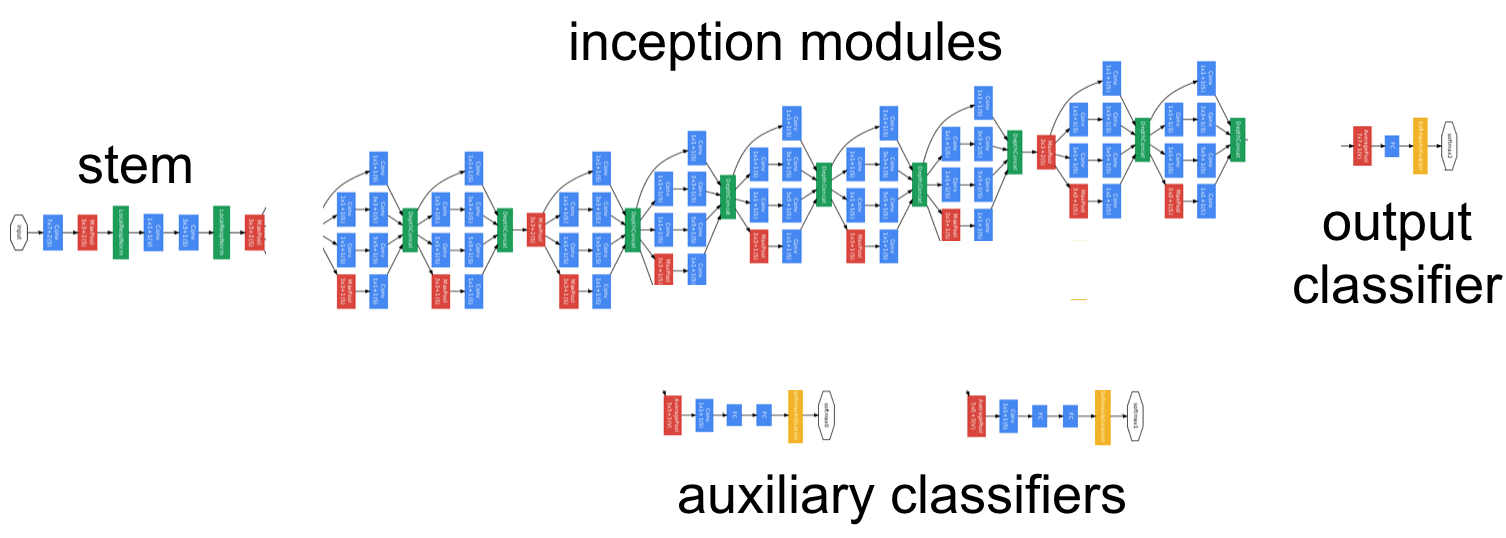
I am also concerned how to visualize networks (e.g. https://github.com/stared/keras-sequential-ascii as I was missing a tool for that) and I do have some experience in data visualization with D3.js (see http://p.migdal.pl/projects/); though I can be opinionated (see: Why do people draw neural networks upside down?, from which I learnt about your tool).
If you have goal to create neural network visualizations as informative as the one above, and as eye-candy as the one bellow, I would be happy to join forces with you (as clearly you have a lot of nice ideas)!