Replies: 3 comments 2 replies
-
|
The line width is always an absolute width regardless of the paper size e.g. 0.25mm is always 0.25mm for any paper size. Matplotlib's auto-scaling feature makes it difficult to control the output paper size. This how-to section shows how to set a specific paper size in inches (matplotlib supports this feature only in inches, 1 in = 25.4 mm). fig.set_size_inches(8, 11)Alternatively, you can set the minimum line width in the configuration settings: import matplotlib.pyplot as plt
import ezdxf
from ezdxf.addons.drawing import RenderContext, Frontend
from ezdxf.addons.drawing.matplotlib import MatplotlibBackend
from ezdxf.addons.drawing.config import Configuration
doc = ezdxf.readfile("your.dxf")
msp = doc.modelspace()
# setup drawing add-on configuration
config = Configuration.defaults()
config = config.with_changes(
min_lineweight=11.8, # in 1/300 inch: 1 mm = 1mm / 25.4 * 300
)
fig: plt.Figure = plt.figure(dpi=300)
ax: plt.Axes = fig.add_axes([0, 0, 1, 1])
ctx = RenderContext(doc)
out = MatplotlibBackend(ax)
Frontend(ctx, out, config=config).draw_layout(msp, finalize=True)There exist also a config = config.with_changes(
min_lineweight=11.8, # in 1/300 inch: 1 mm = 1mm / 25.4 * 300,
lineweight_scaling=3.0,
)And there are additional how-to's for controlling pixel density per drawing unit or output scale. EDIT: With pixel-based output formats (PNG, JPEG) it is very important to set a suitable DPI value (dots per inch)! |
Beta Was this translation helpful? Give feedback.
-
|
Thanks for your reply! |
Beta Was this translation helpful? Give feedback.
-
|
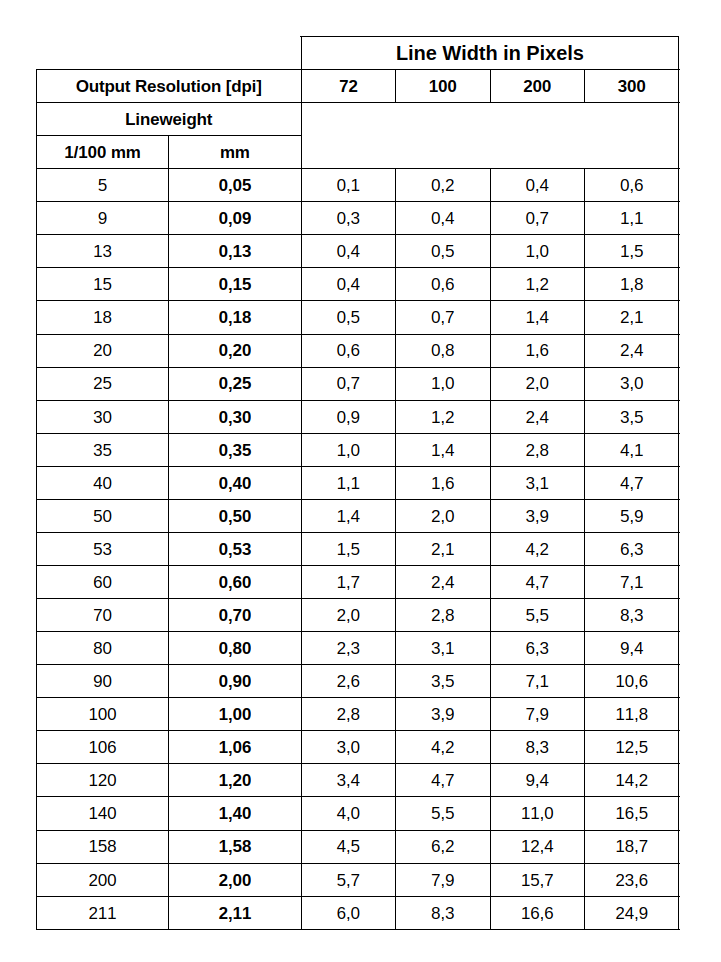
The following table shows the line width in pixels for all valid DXF lineweights for a resolution of 72, 100, 200 and 300 dpi:
|
Beta Was this translation helpful? Give feedback.
-
|
Very helpful, thank you! |
Beta Was this translation helpful? Give feedback.
-
|
depending on the size of the file, the lineweight value differs for shapes in pdf file we can decativate this by giving lineweight_scaling=0.0, but i need to export a pdf file(having different lineweights for different shapes) that don't change lineweight value based on the scaling anyone with solution for this ? def pdf_creation(self):
ax: plt.Axes = self.fig.add_axes([0, 0, 1, 1])
ctx = RenderContext(self.doc)
# Get the modelspace properties
msp_properties = LayoutProperties.from_layout(self.msp)
# Set light gray background color and black foreground color
msp_properties.set_colors("#FFFFFF", "#000000")
# msp_properties.lineweight_scaling = 1.0
# for entity in self.msp:
# entity.dxf.lineweight = -3
config = Configuration.defaults()
config = config.with_changes(
min_lineweight=0.05, # in 1/300 inch: 1 mm = 1mm / 25.4 * 300
lineweight_scaling=0.5
)
out = MatplotlibBackend(ax)
# Override the layout properties and render the modelspace
Frontend(ctx, out,config=config).draw_layout(self.msp, finalize=True, layout_properties=msp_properties) |
Beta Was this translation helpful? Give feedback.
Uh oh!
There was an error while loading. Please reload this page.
-
Hello,@mozman
If the dxf file contains very few entities, the dxf converted to png will have very shallow lines in the png. It seems to stretch the already small figure in equal proportion, but the lines do not thicken in equal proportion.
Below are the dxf files I used for testing and the png images I generated.
test.zip
Is there any way to generate png images with different thickness lines according to the number of different entities or the overall size of the dxf file?
Beta Was this translation helpful? Give feedback.
All reactions