-
|
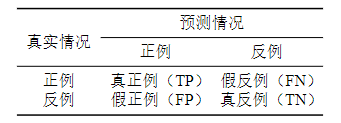
大佬,请问,这种样式的表格应该怎么绘制?我参考代码示例模仿着写了一下,还是写不正确,请求大佬指点一下,谢谢 |
Beta Was this translation helpful? Give feedback.
Answered by
note286
Mar 25, 2023
Replies: 3 comments 1 reply
-
|
给出你写失败的代码。 |
Beta Was this translation helpful? Give feedback.
0 replies
-
  \begin{table}
    \centering
    \caption{Complexity Comparison: Puncturing and Extending (重制版)}
    \begin{tblr}{colspec={ccc},cell{1}{1}={r=2}{},hline{1,Z}   = {wd=.08em},cell{1}{2}={r=1}{},hline{2,3}={wd=.05em}}
    真实情况                 &           预测情况                \\
                          &正例 & 反例\\
       正例 & 真正例(TP)     &假反例(FN)                \\
       反例 & 假正例(FP)     & 真反例(TN)                 \\
    \end{tblr}
    \end{table}
这是我写的代码,还是有点问题,您看下。 |
Beta Was this translation helpful? Give feedback.
0 replies
-
|
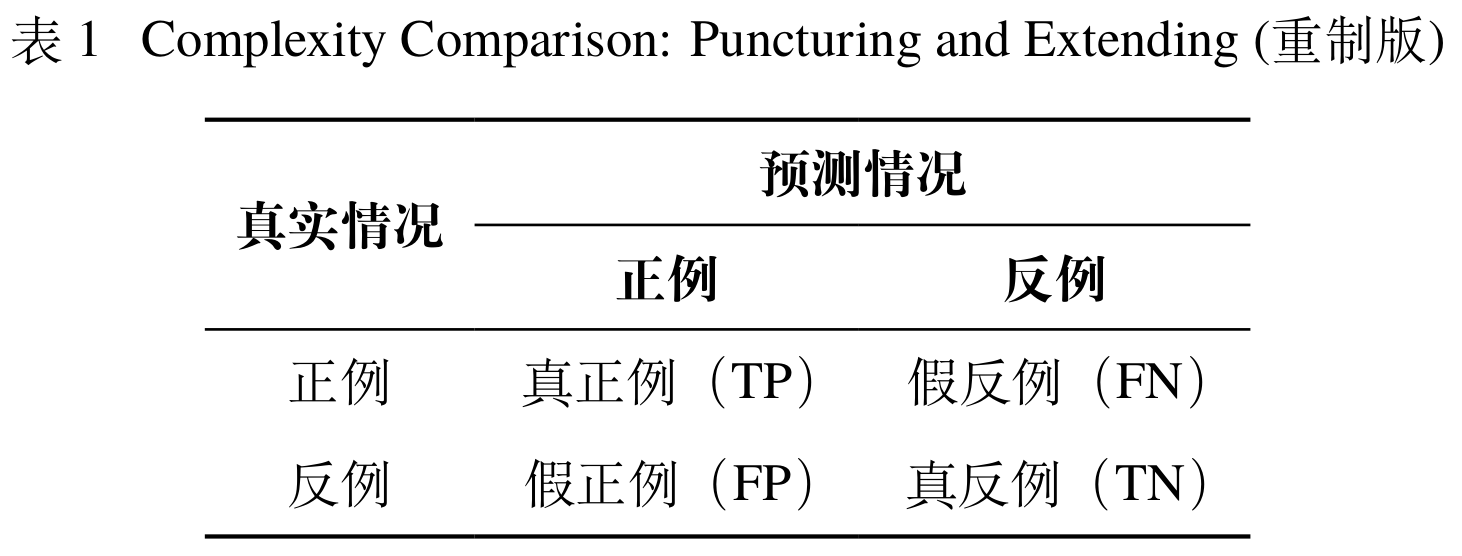
我建议你看一下 \documentclass{xdupgthesis}
\usepackage{tabularray}
\begin{document}
\begin{table}
\centering
\caption{Complexity Comparison: Puncturing and Extending (重制版)}
\begin{tblr}
{
colspec = {Q[c,m]Q[c,m]Q[c,m]},
cell{1}{1} = {r=2}{},
cell{1}{2} = {c=2}{},
row{1,2} = {cmd=\bfseries},
hline{1,Z} = {wd=.08em},
hline{2,3} = {wd=.05em},
}
真实情况 & 预测情况 & \\
& 正例 & 反例 \\
正例 & 真正例(TP) & 假反例(FN) \\
反例 & 假正例(FP) & 真反例(TN) \\
\end{tblr}
\end{table}
\end{document}
|
Beta Was this translation helpful? Give feedback.
1 reply
-
|
好的好的,我在看一下手册,谢谢大佬!!! |
Beta Was this translation helpful? Give feedback.
Answer selected by
note286
Sign up for free
to join this conversation on GitHub.
Already have an account?
Sign in to comment
我建议你看一下
tabularray手册,我给的示例不可能涵盖所有情况,而且也没有对键值的含义做出解释。