Discussion #585
-
|
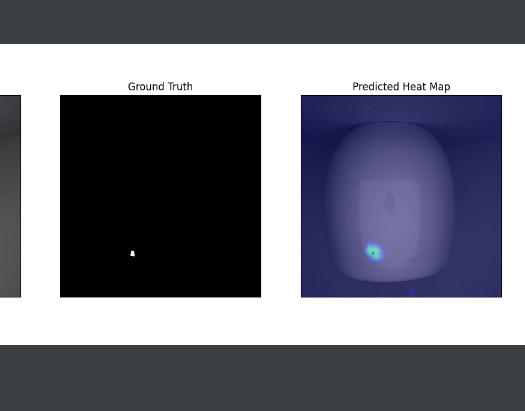
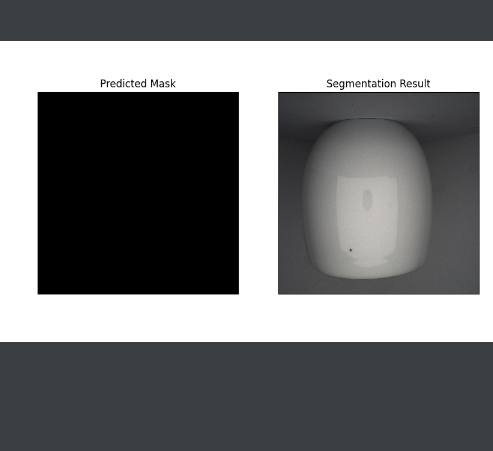
I am a student comes from China,so my English is not very good.I want to ask you another question, and look forward to your reply.My defects can be displayed on the heatmaps, but they can't be circled on the pre mask. What parameters do I need to adjust and turn them up or down? My test results are not very good,like these. |
Beta Was this translation helpful? Give feedback.
Replies: 1 comment 1 reply
-
|
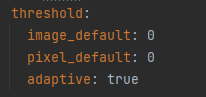
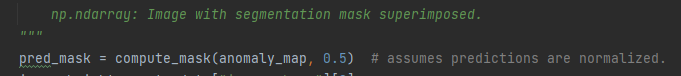
Copying the answer from #579 (reply in thread) The segmentation maps are generated from the threshold. So while the heatmap might show something the threshold determines the value above which the predicted values are considered as anomalies. Normalization ensures that this threshold is centred to 0.5. So, when generating the segmentation masks the anomalous regions are the ones with values greater than 0.5.
|
Beta Was this translation helpful? Give feedback.
-
|
Beta Was this translation helpful? Give feedback.
Copying the answer from #579 (reply in thread)
The segmentation maps are generated from the threshold. So while the heatmap might show something the threshold determines the value above which the predicted values are considered as anomalies. Normalization ensures that this threshold is centred to 0.5. So, when generating the segmentation masks the anomalous regions are the ones with values greater than 0.5.