USing 2D model for 1D signal (converted to image) #798
-
|
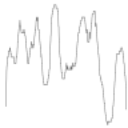
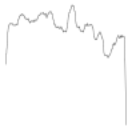
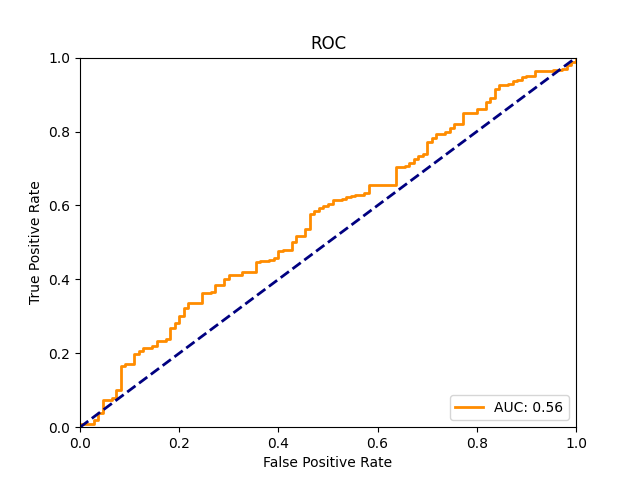
Hello, I got those results : After that , I tried with the patchcore and got phenomenal results : Those results are miles ahead of everything done in the literature of anomaly detection in my application. The best I saw in the literature would be a F1 score of 0.75 and the roc curve looks like this: I dont want to do a publication on the subject yet , but if I do , would strongly consider using this library. My second question : Here is a normal image : Here is an abnormal image : My second question : Thank you! |
Beta Was this translation helpful? Give feedback.
Replies: 1 comment 2 replies
-
|
Hi, thanks for your question. This sounds like an interesting use-case.
In Anomalib, we evaluate the F1 score at the optimal threshold value. This means that the displayed F1 score is the best F1 score that you can get by varying the threshold applied to the model's raw predictions. If the AUROC score is low while the F1 score is high, this means that the performance of the model can be very good for the specific, optimal, threshold value, but the model performs poorly at most other threshold values. To get a better idea of the threshold-dependent behaviour of your model, you could visually inspect the ROC curve, which is generated automatically by Anomalib. Just make sure that the
I would be concerned about that, yes. By converting your 1D data to a 2D plot, you are increasing the dimensionality while the amount of information in your dataset remains the same. In other words, you introduce sparsity to your dataset which is a recipe for overfitting. For this reason I would generally expect better results from a 1D model trained on a time-series signal, than a 2D model trained on a plot of that signal. (Of course, this also depends largely on picking the right model which may not be a trivial task). A better approach (at least theoretically) would be to convert your 1D data to spectrograms before using them as input of the Anomalib models. By transforming your data to the frequency domain, you introduce new potentially useful information that your models can leverage to learn the characteristics of the data distribution. We haven't tested any of the models in Anomalib on 2D representations of 1D data, but we are definitely interested in the topic. It would be great if you would be willing to share any interesting findings with us in this thread (or elsewhere). If the spectrogram approach works we could potentially add some utility functions to convert 1D data, which would facilitate working with audio and 1D data.
We provide several entrypoint scripts for running inference in different frameworks. The easiest inference method is PyTorch Lightning inference. You can point the script to your trained model file, and a folder of image data, and the script will generate and visualize the model's predictions on the images. If you're having trouble running inference on your dataset or if anything is unclear, please let us know. |
Beta Was this translation helpful? Give feedback.
-
|
Hello, I will be meeting with my prof in January to talk about this avenue. It would be a very different approach than the rest of literature. I cannot yet speak about the specifics of the application as of now. It is one of my preoccupation that overfitting would happen with an image based approach(especially when my database is only of 552 segments when it is not augmented). I was inspired to use this approach with this paper https://paperswithcode.com/paper/ecg-arrhythmia-classification-using-a-2-d .It got great results that i was able to reproduce. It is a great proposition to work in the frequency domain. I will explore this avenue some more. I will definitively keep in touch with this thread. One way I could verify the generalization, it would be to test on an other database that is completely independant from the one I used. Thank you so much for those answers, it helps alot! I will reach out if I have other results or other questions. |
Beta Was this translation helpful? Give feedback.
-
|
Hello, |
Beta Was this translation helpful? Give feedback.
Hi, thanks for your question. This sounds like an interesting use-case.
In Anomalib, we evaluate the F1 score at the optimal threshold value. This means that the displayed F1 score is the best F1 score that you can get by varying the threshold applied to the model's raw predictions. If the AUROC score is low while the F1 score is high, this means that the performance of the model can be very good for the specific, optimal, threshold value, but the model performs poorly at most other threshold values. To get a better idea of the threshold-dependent behaviour of your model, you could visually inspect the ROC curve, which is generated auto…